The Effects of Illiteracy and Poverty on Child Care and Development

The all-round well-being of a child is directly and indirectly influenced by several factors. However, the most defining factor remains the basic unit of every community, the family. How much effect do the wealth and exposure of the parents have on child care? This analysis approaches child care using two critical metrics, vaccination and proper growth.
In this story-styled documentation, we will explore the effects of poverty and literacy – or a lack of it – on the development of children in Nigeria.
Data Source
The datasets used in this analysis were gathered by different organisations but hosted on DivaGIS and Worldpop.org's database as seen in the table below.
SN | Dataset | Resolution | Source |
1 | State boundaries |
| DivaGIS |
2 | 1Km | WorldPop | |
3 | 1Km | WorldPop | |
4 | 1Km | WorldPop | |
5 | 1Km | WorldPop | |
6 | 1Km | WorldPop | |
7 | 1Km | WorldPop | |
8 | 1Km | WorldPop | |
9 | 1Km | WorldPop | |
10 | 1Km | WorldPop | |
11 | 1Km | WorldPop | |
|
|
|
|
Data Cleaning
The data used in this analysis required no major extra touches. One minor defect observed is the availability of population data (and by extension, every other dataset) for Lake Chad.

This is unsurprising due to the methods employed in data collection. While they have not been included in the derived insights, they remain a relevant part of each acquired data.
Data Exploration
All datasets will be explored by states. The purpose of the analysis is to determine if a relationship can be drawn between the states having the lowest literacy and highest poverty ratios with the states having the highest ratios for stunted growths and low vaccinations.
As stated in each documentation cited above, each data is stored in pixels with each pixel having varying resolutions and numbers. Using the QGIS desktop software, zonal statistics were performed on all acquired data against the state boundary data to determine the distribution of these pixels across each state. The most relevant parameter in this analysis is the sum, that is, the sum of all pixel values in each state.
First, how was the population distributed in 2015?
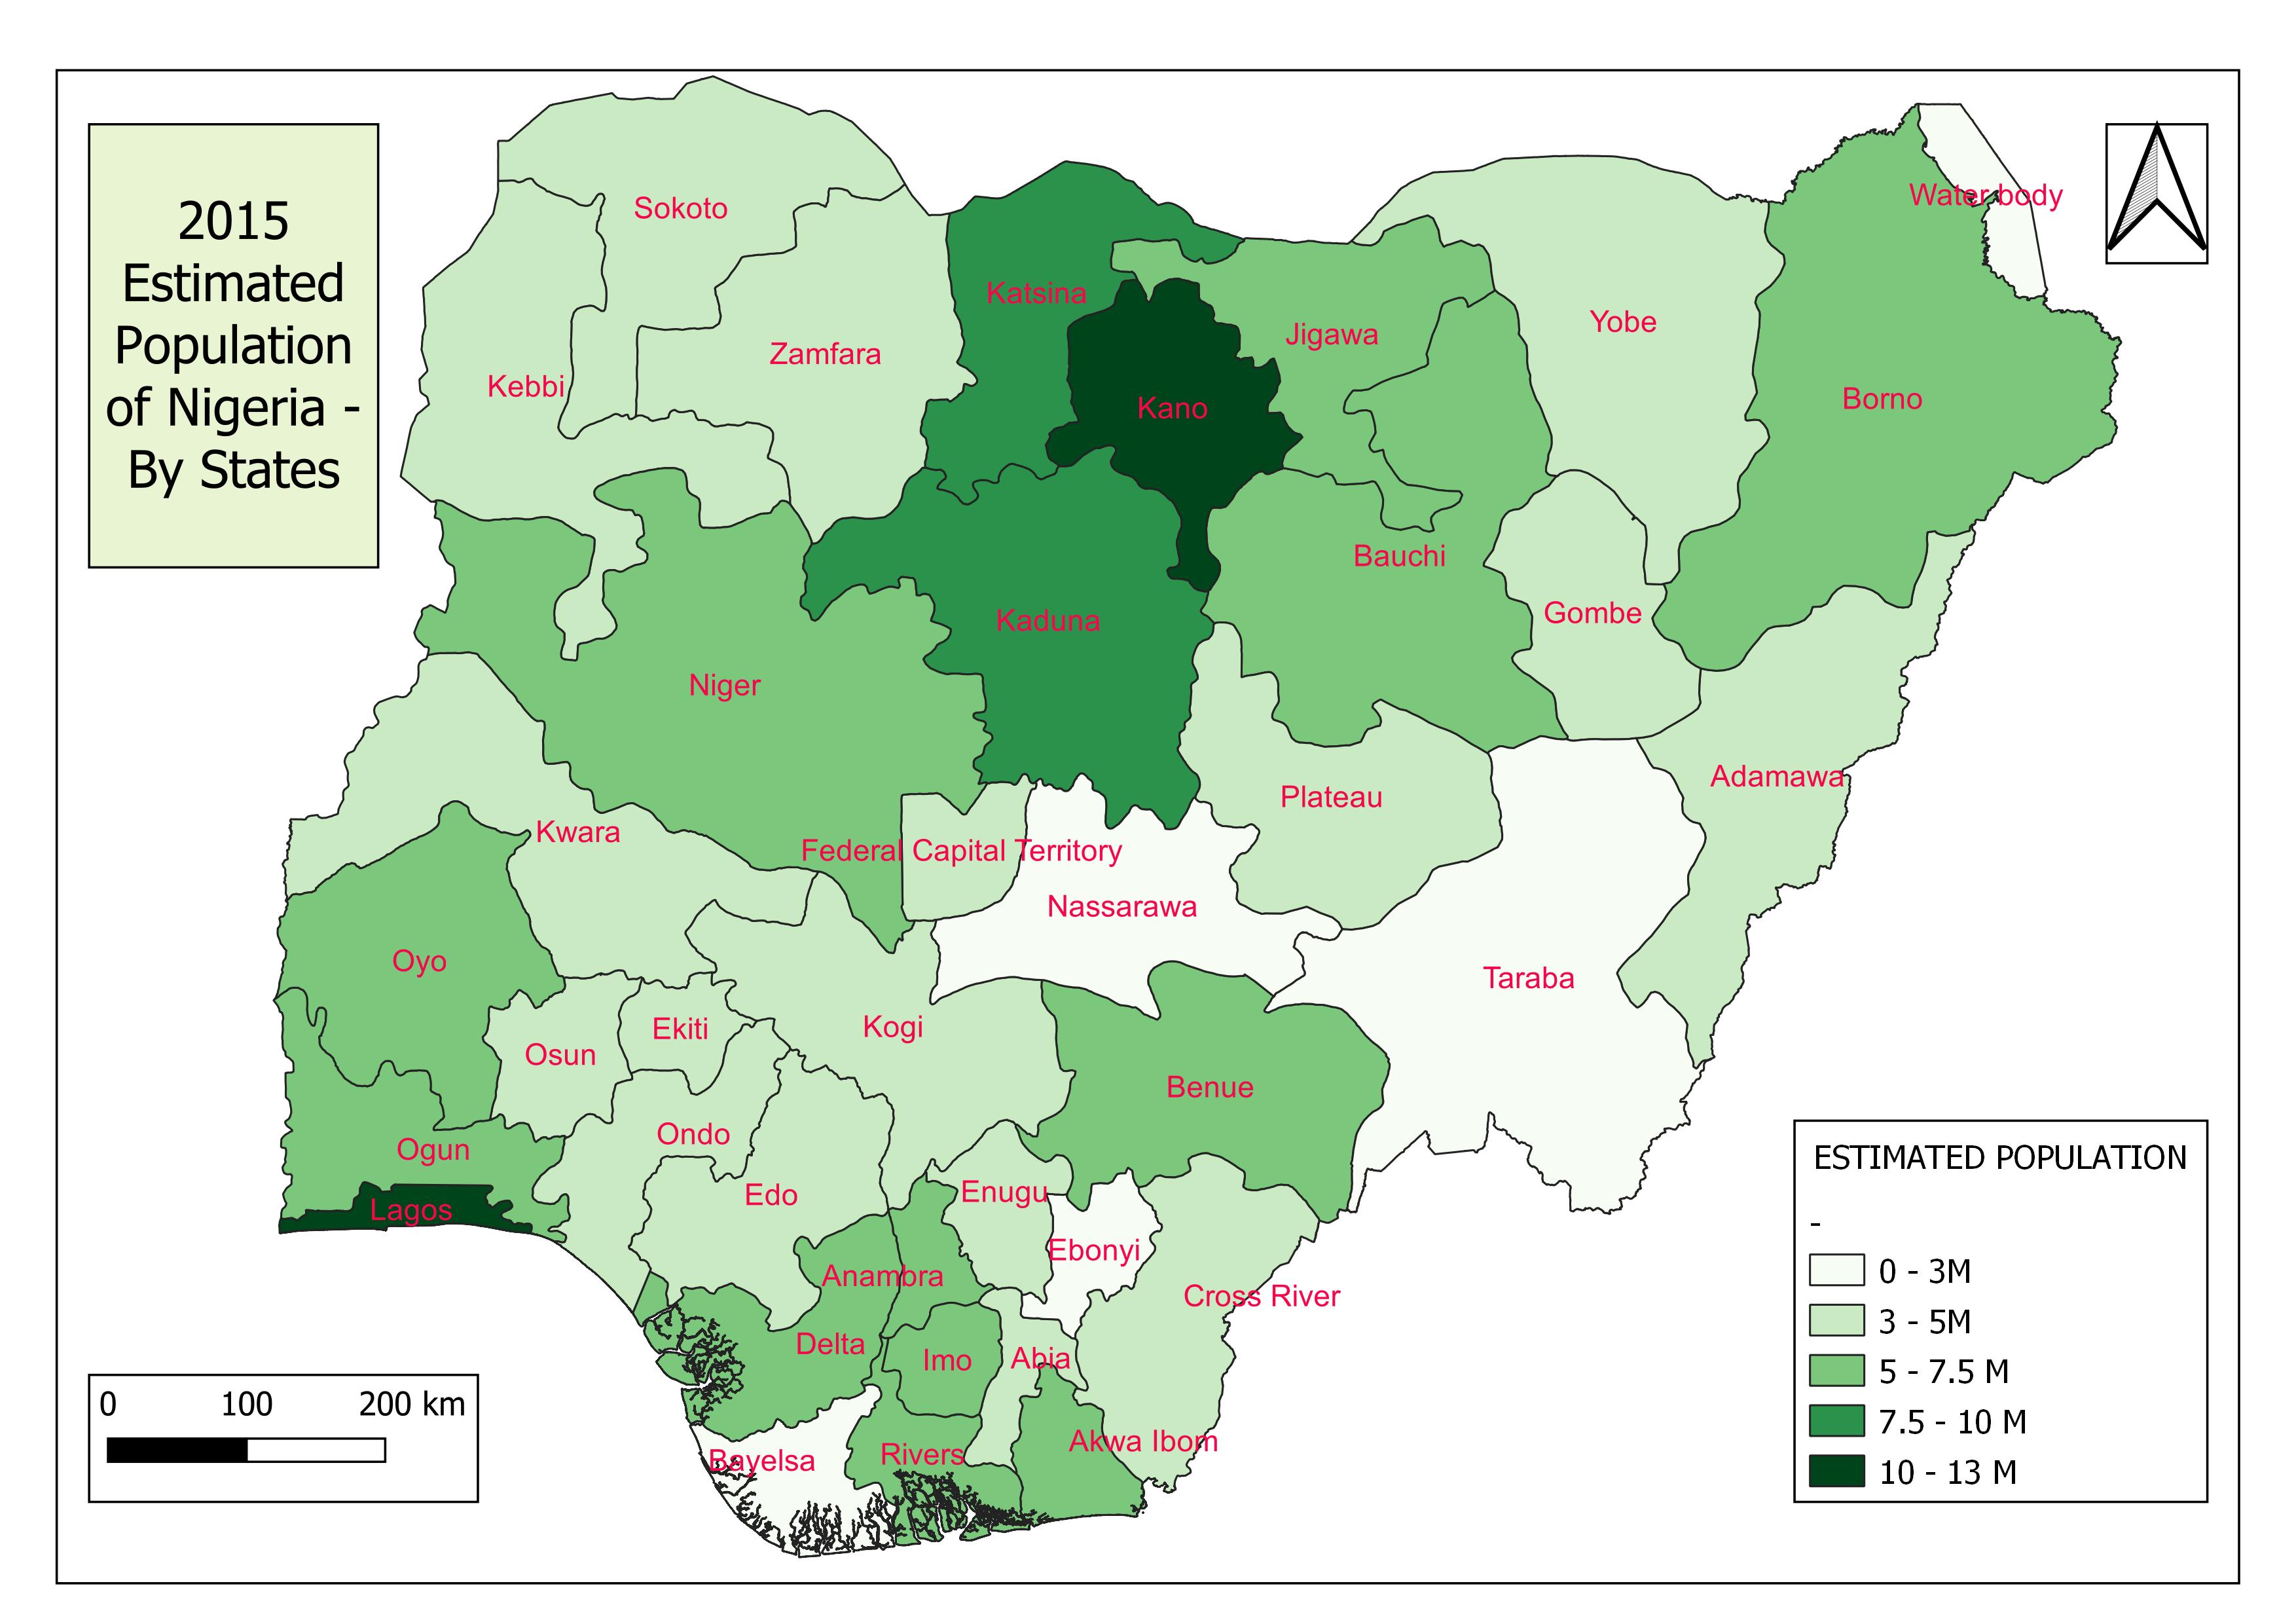
As shown in the map above, Lagos and Kano's states have the largest population shares, with the other two famous “Ks”, Katsina and Kaduna state closely behind at 7.5+ million.
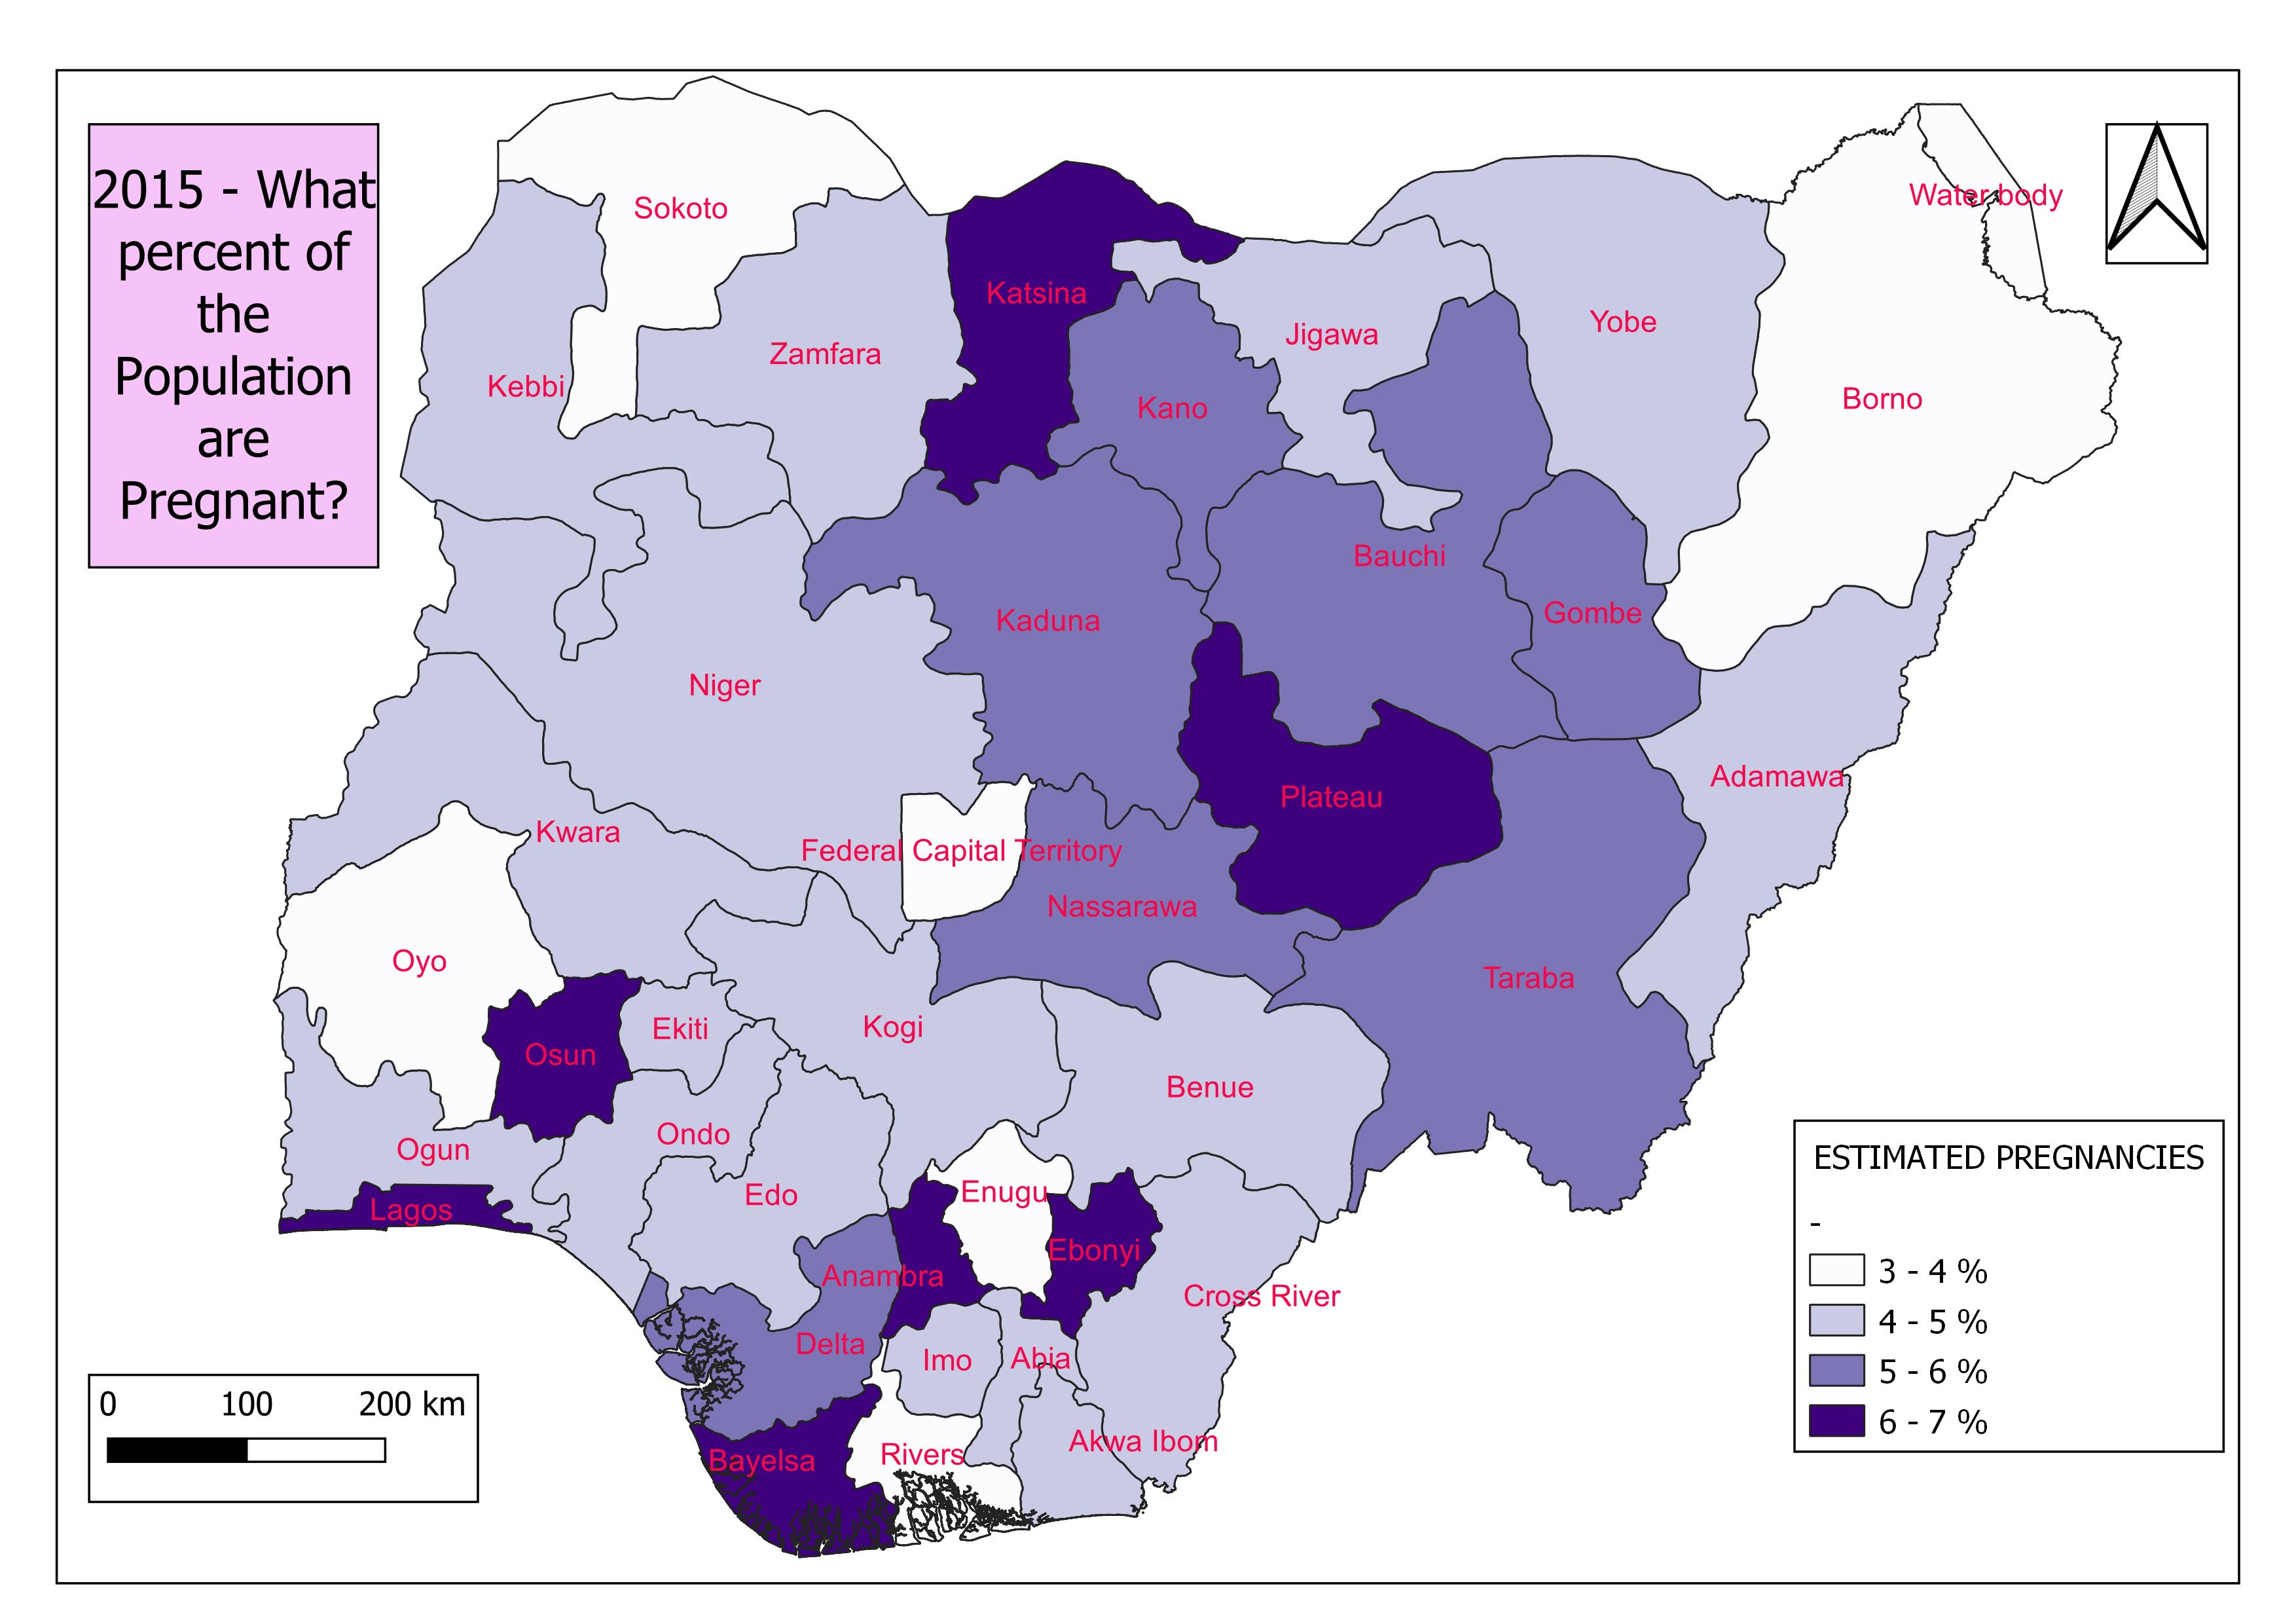
The number of pregnancies recorded in 2015 does not follow a similar pattern. Instead, of the four states mentioned above, only Lagos state records above 6% of its 2015 population as pregnant.
To perform this analysis a PostgreSQL database was created using PgAdmin and connected to QGIS using the data source manager tool. The required SQL script was written and executed using the QGIS Database Manager tool.
First, a new table showing a summation of all statistics by states was created using the following SQL code:
SELECT     birth.name_1 as state, population.population_sum,

            birth._sum as births_sum, litracy_F.litracy_f_sum,

            litracy_M.litracy_m_sum, poverty_125.pov_125_sum,

            poverty_200.pov_200_sum, stunted_F.stunted_f_sum,

            stunted_M.stunted_m_sum, pregnancy.pregs_sum,

            vacc.vacinated_sum, population.geom

FROM public.birth

INNER JOIN public.population on population.name_1 = birth.name_1

INNER JOIN public.litracy_F on litracy_F.name_1 = birth.name_1

INNER JOIN public.litracy_M on litracy_M.name_1 = birth.name_1

INNER JOIN public.poverty_125 on poverty_125.name_1 = birth.name_1

INNER JOIN public.poverty_200 on poverty_200.name_1 = birth.name_1

INNER JOIN public.stunted_F on stunted_F.name_1 = birth.name_1

INNER JOIN public.stunted_M on stunted_M.name_1 = birth.name_1

INNER JOIN public.pregnancy on pregnancy.name_1 = birth.name_1

INNER JOIN public.vacc on vacc.name_1 = birth.name_1
The resulting table was loaded as a new layer to the QGIS map canvas under the name: ‘childcare_sum with the geometry column (geom) set as its spatial index.
Next, the percentage was calculated using their respective relevant pairs as shown in the code below.
SELECT     state, population_sum,

            births_sum/pregs_sum * 100 as percentage_births,

            (litracy_f_sum+litracy_m_sum)/population_sum * 100 as percentage_litracy,

            pov_125_sum/population_sum * 100 below_1_25,

            pov_200_sum/population_sum * 100 below_2_00,

            pregs_sum/population_sum * 100 percentage_pregnancies,

            stunted_f_sum/births_sum * 100 percentage_f_stunted,

            stunted_m_sum/births_sum * 100 percentage_m_stunted,

            (stunted_f_sum+stunted_m_sum)/population_sum * 100 percentage_stunted,

            vacinated_sum/births_sum * 100 percentage_vacinated,

            geom

FROM   childcare_sum
Now, using the estimated number of births in 2015, we can project what percentage of these pregnancies will lead to successful childbirths. That is the ratio of births to pregnancies.
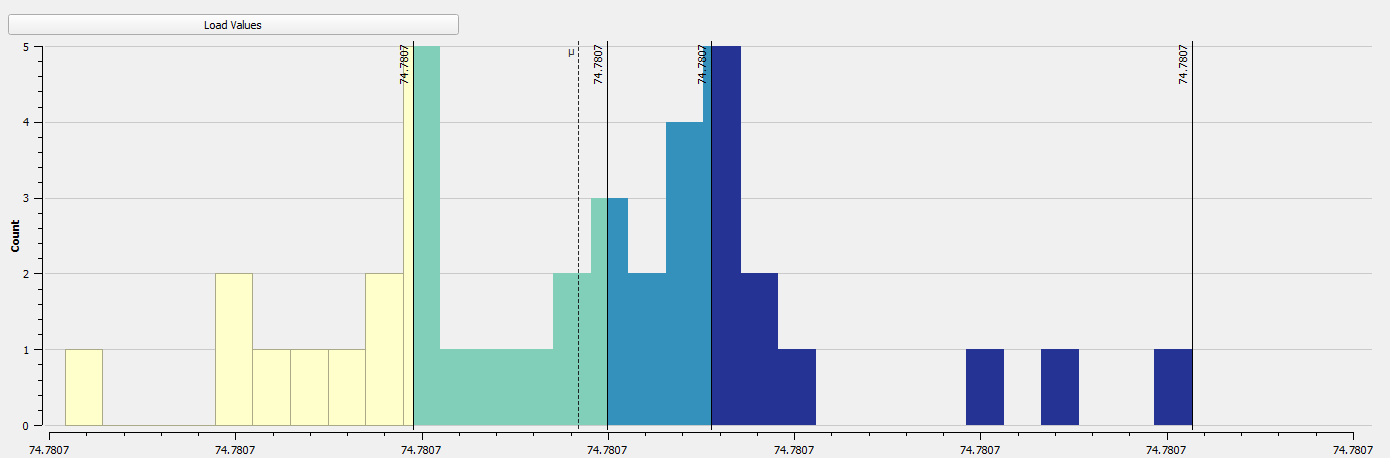
As shown in the histogram, 74.78% (same figure across states) of the pregnancies recorded in 2015 lead to births. While this isn’t an exact record considering the bulk of pregnancies in 2015 were birthed the following year, it gives an idea of where the country stands with respect to successful deliveries.
Let's go ahead to understand the status of these parents. What are their financial strengths? How educated are they?
Poverty thresholds are used in calculating the financial strengths of poor countries. In this analysis, two international Poverty Lines (IPL) were used. Here, we consider what percentage of the Nigerian population lives below $2.00 per day and $1.25 per day.
By performing zonal statistics and the proportions described earlier, the following maps were derived.
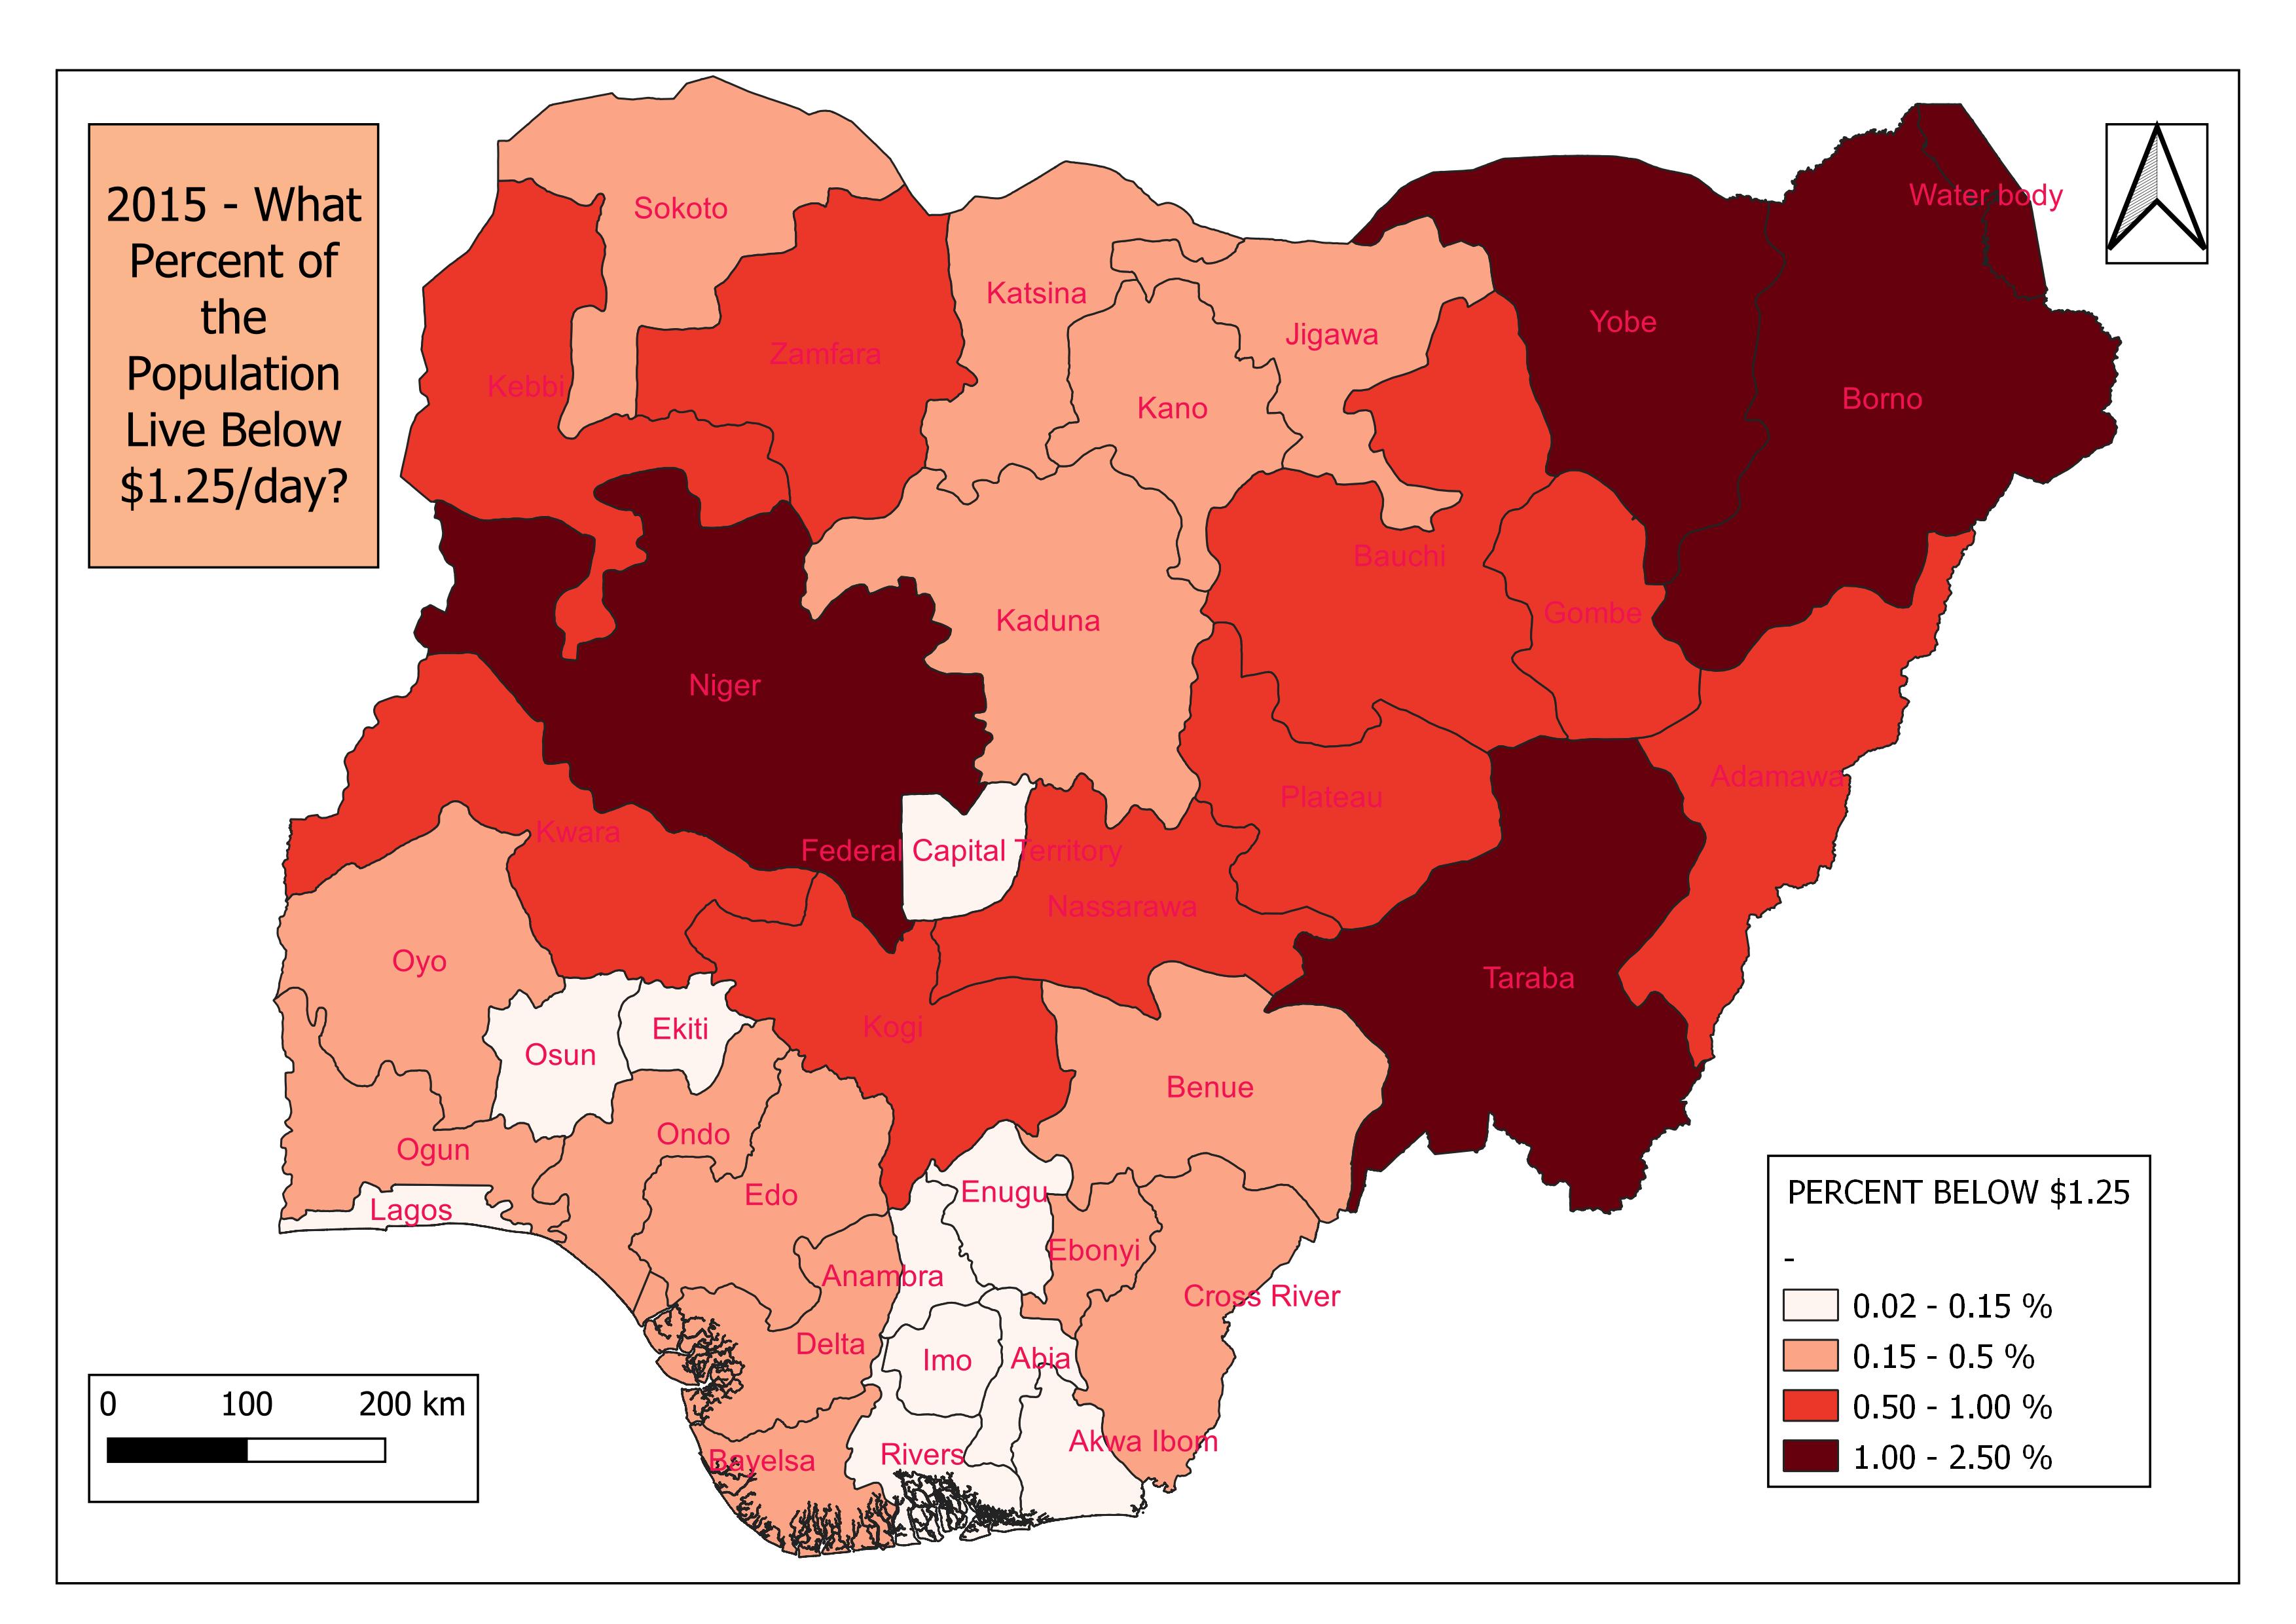
The map above shows the states having a larger percentage of their population living below $1.25 per day. Taraba and Yobe states top the pile (1.8% and 1.5% respectively) with Borno and Niger states completing the group having above 1% of its population living below the IPL mark.
For nearly double that standard of living let's see which other states have above 1% of their population in deep red.
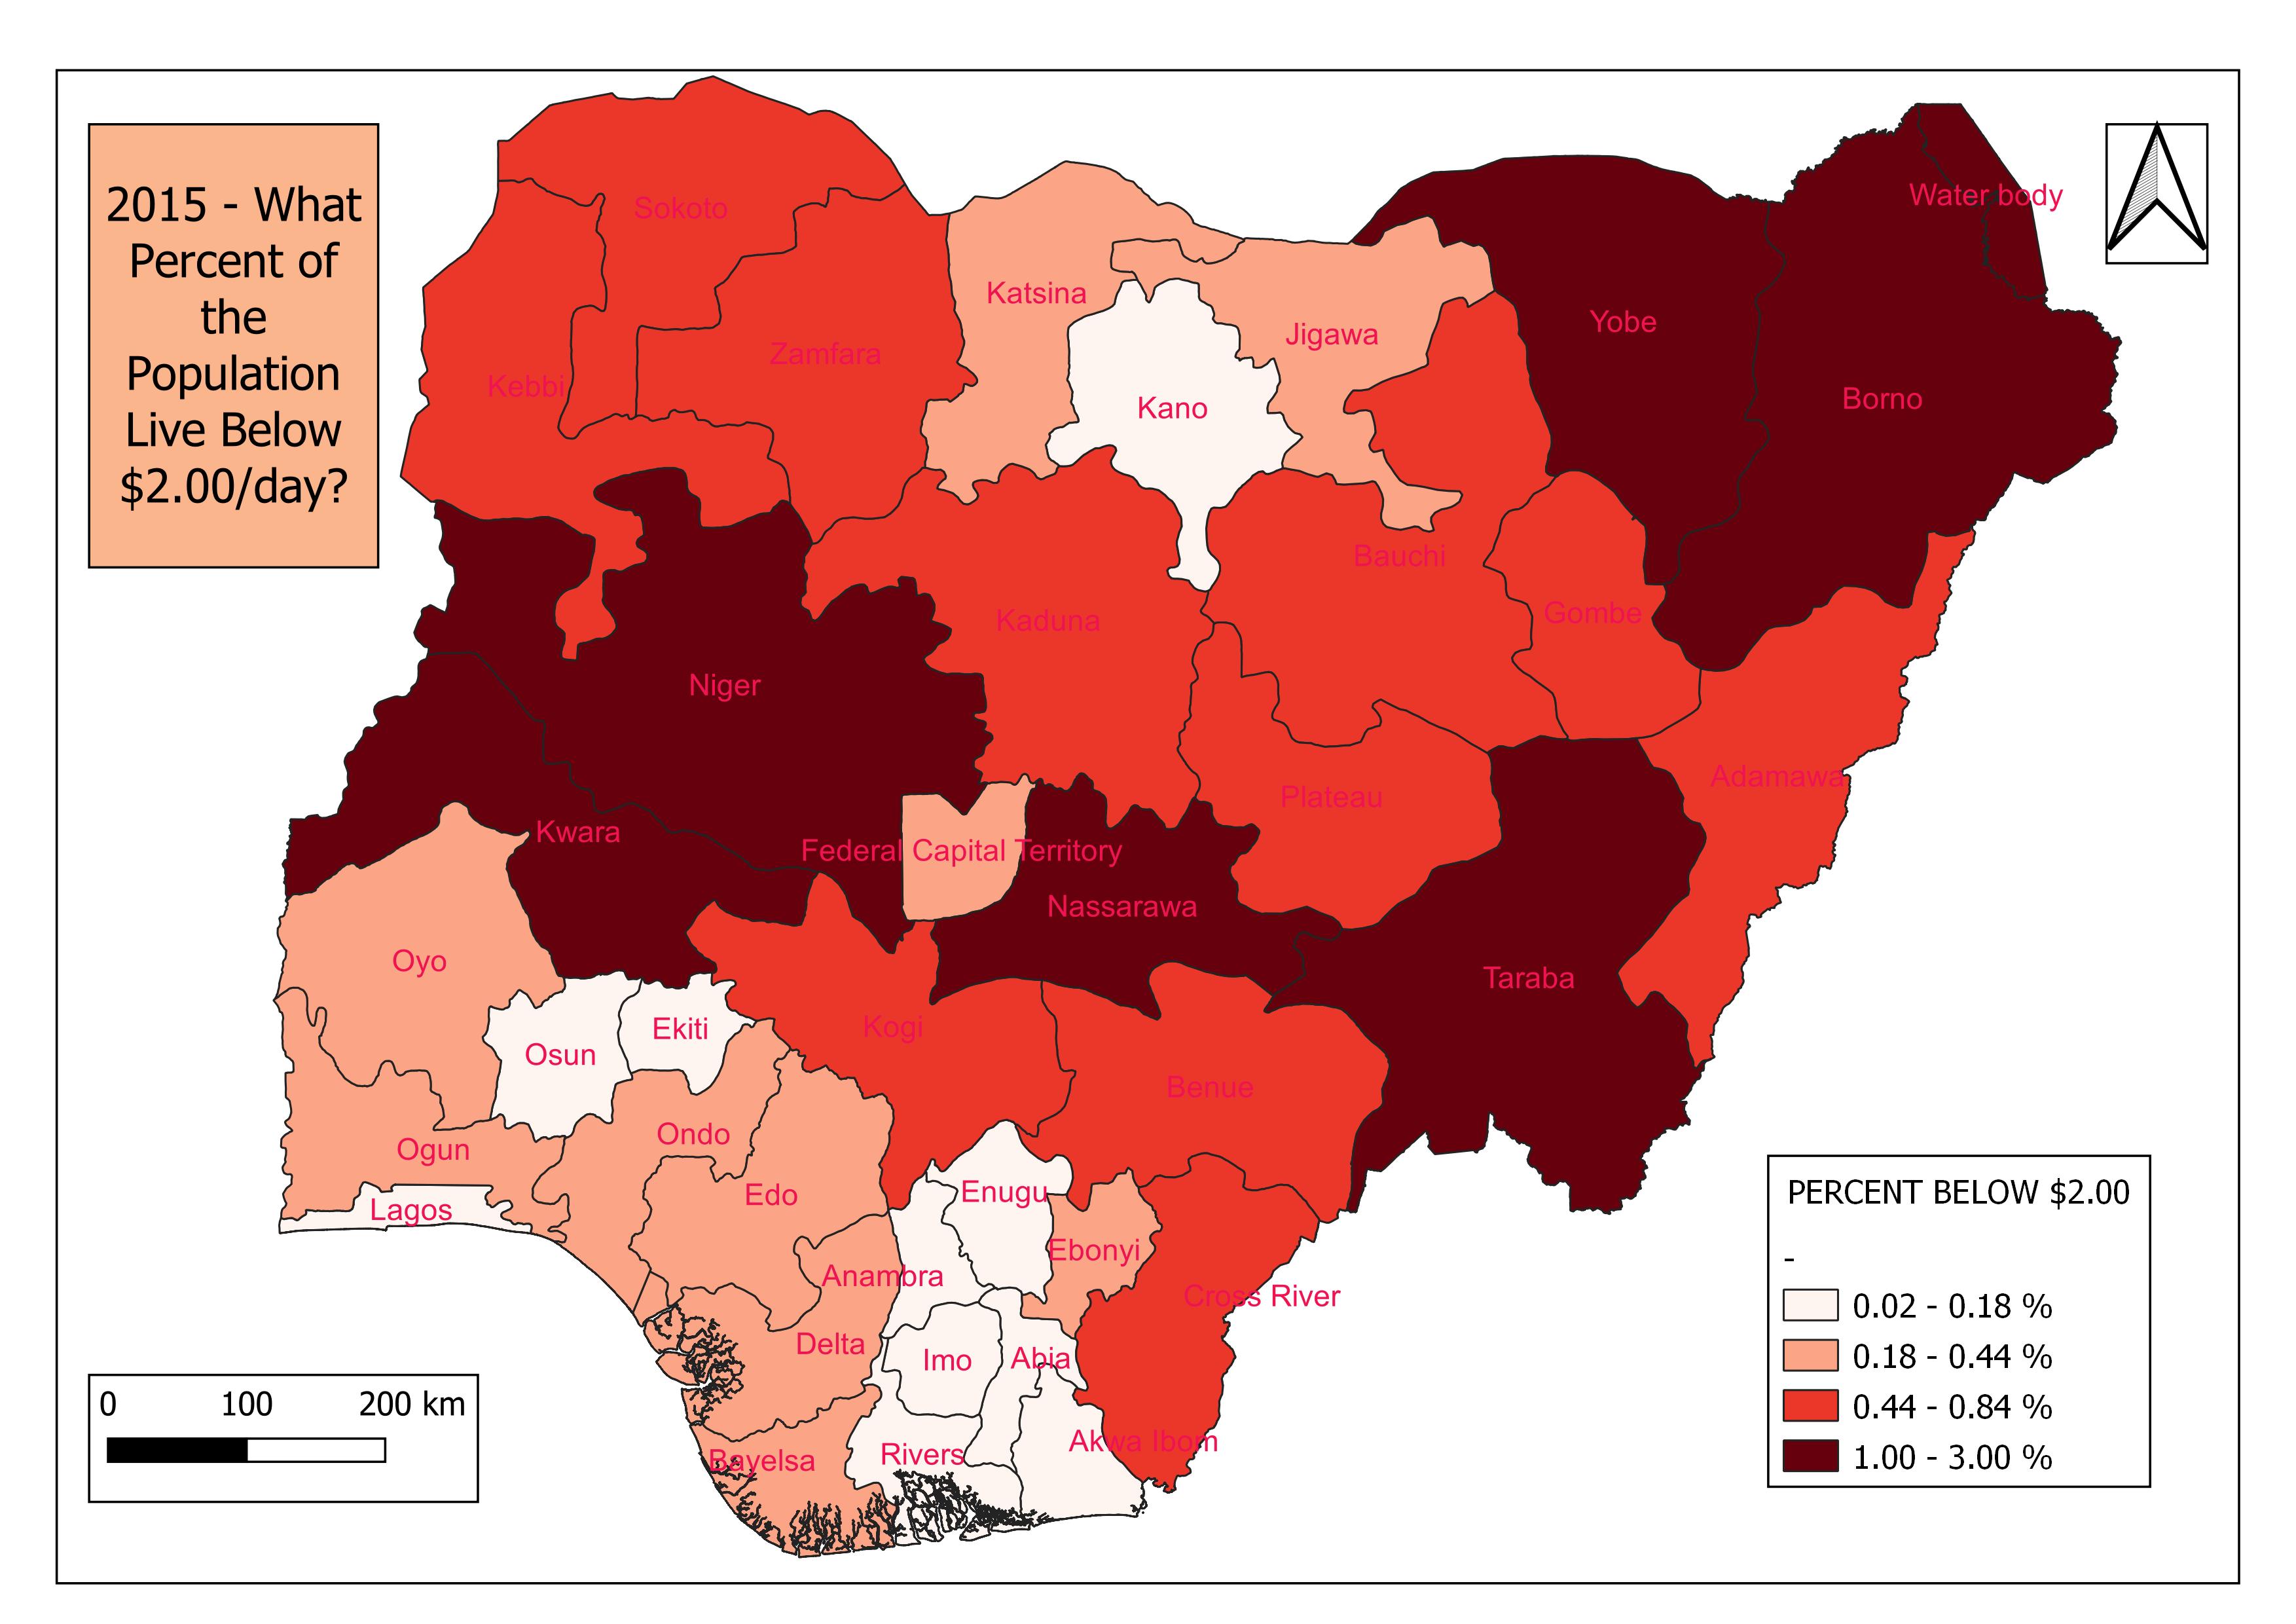
This adds Kwara and Nasarawa states to the list. It is worth noting that of all 6 states having above 1% of the population in this category, only Taraba state has greater than 2% of its population surviving on less than $2.00 per day. Penury!
Still on the parent's status, let's consider literacy levels. The acquired data estimates the proportion of men and women aged 15-49 per grid square that were classed as literate. Using the same analytical approach, the following maps show the proportion of literates to illiterates in each state, classified according to gender.
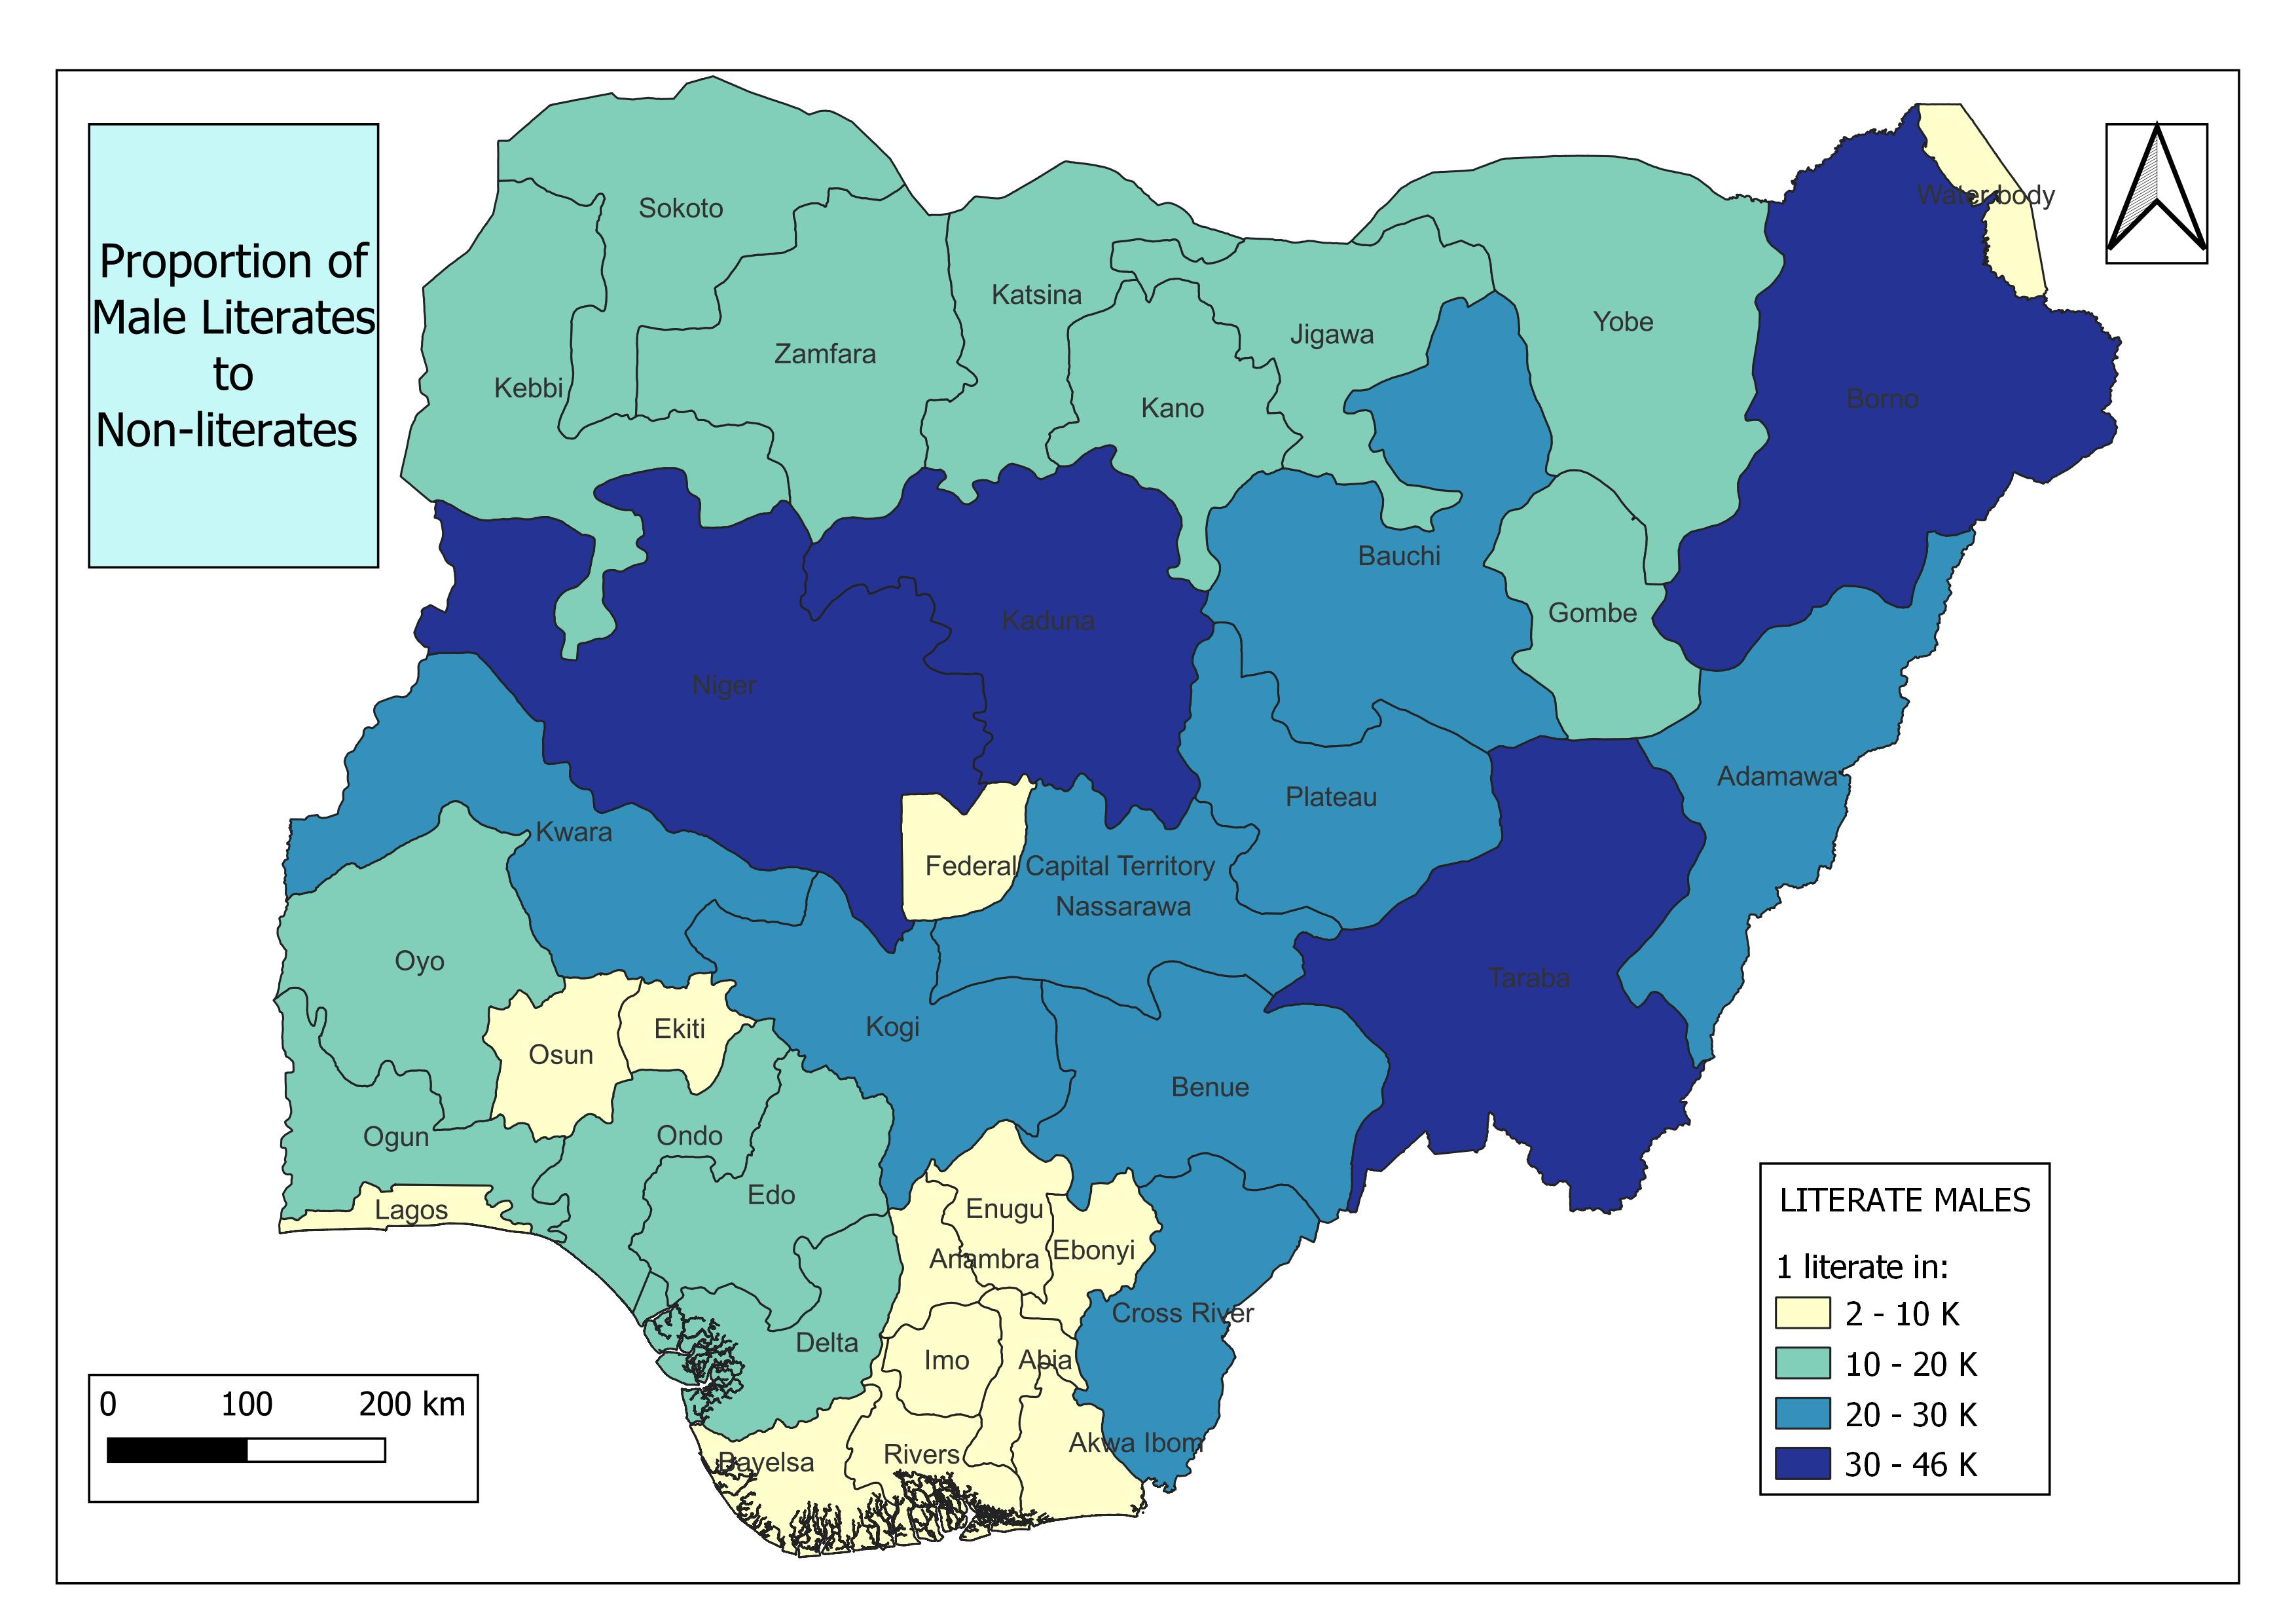
Here, Kaduna, Borno and Niger states join Taraba in recording high literate to illiterate proportions of males. With the latter two recording a ratio of over 1:40,000.
While the numbers are less worrying for their female counterparts, the trend remains the same for the states involved.
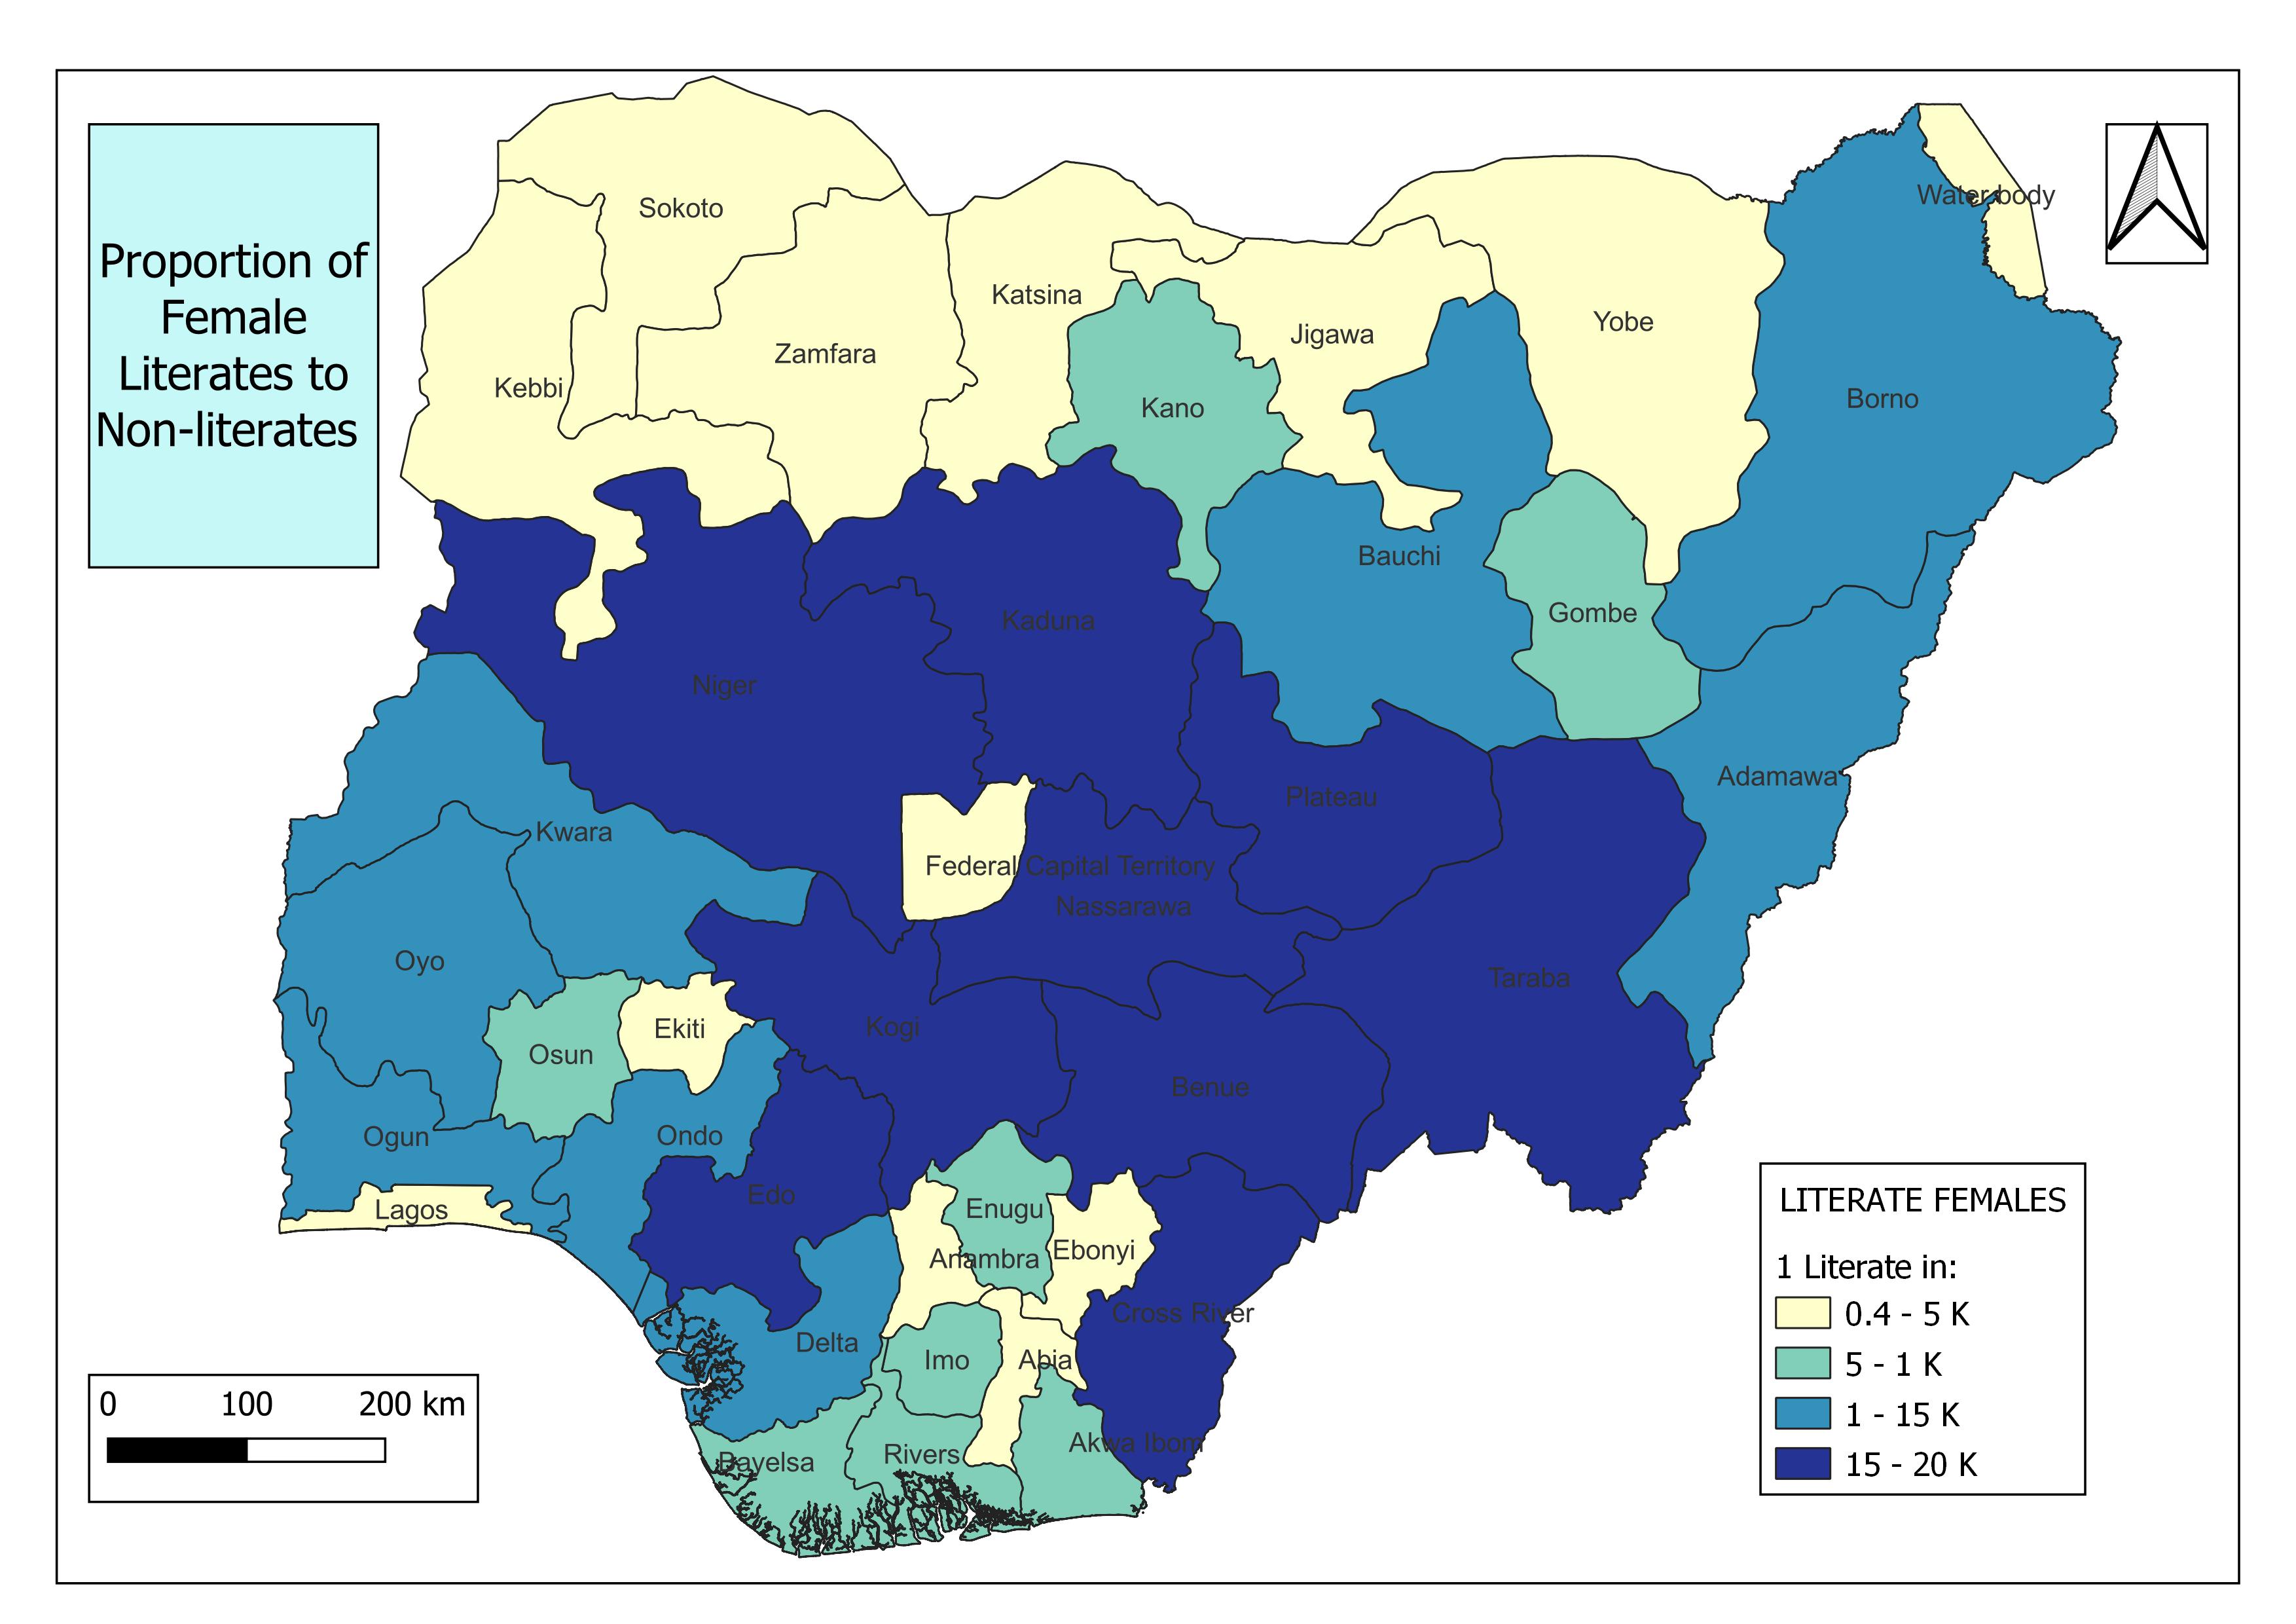
And on it goes.
Now we consider the effect on child care and development. As stated earlier, two essential metrics will be used, namely healthy growths and vaccinations taken in the year.
The healthy growth of children in Nigerian states can be understood using estimates of the proportion of male and female children aged under 5, per grid square that were classified as stunted. Performing the described analysis on this data produces two super identical maps for Males and Females.
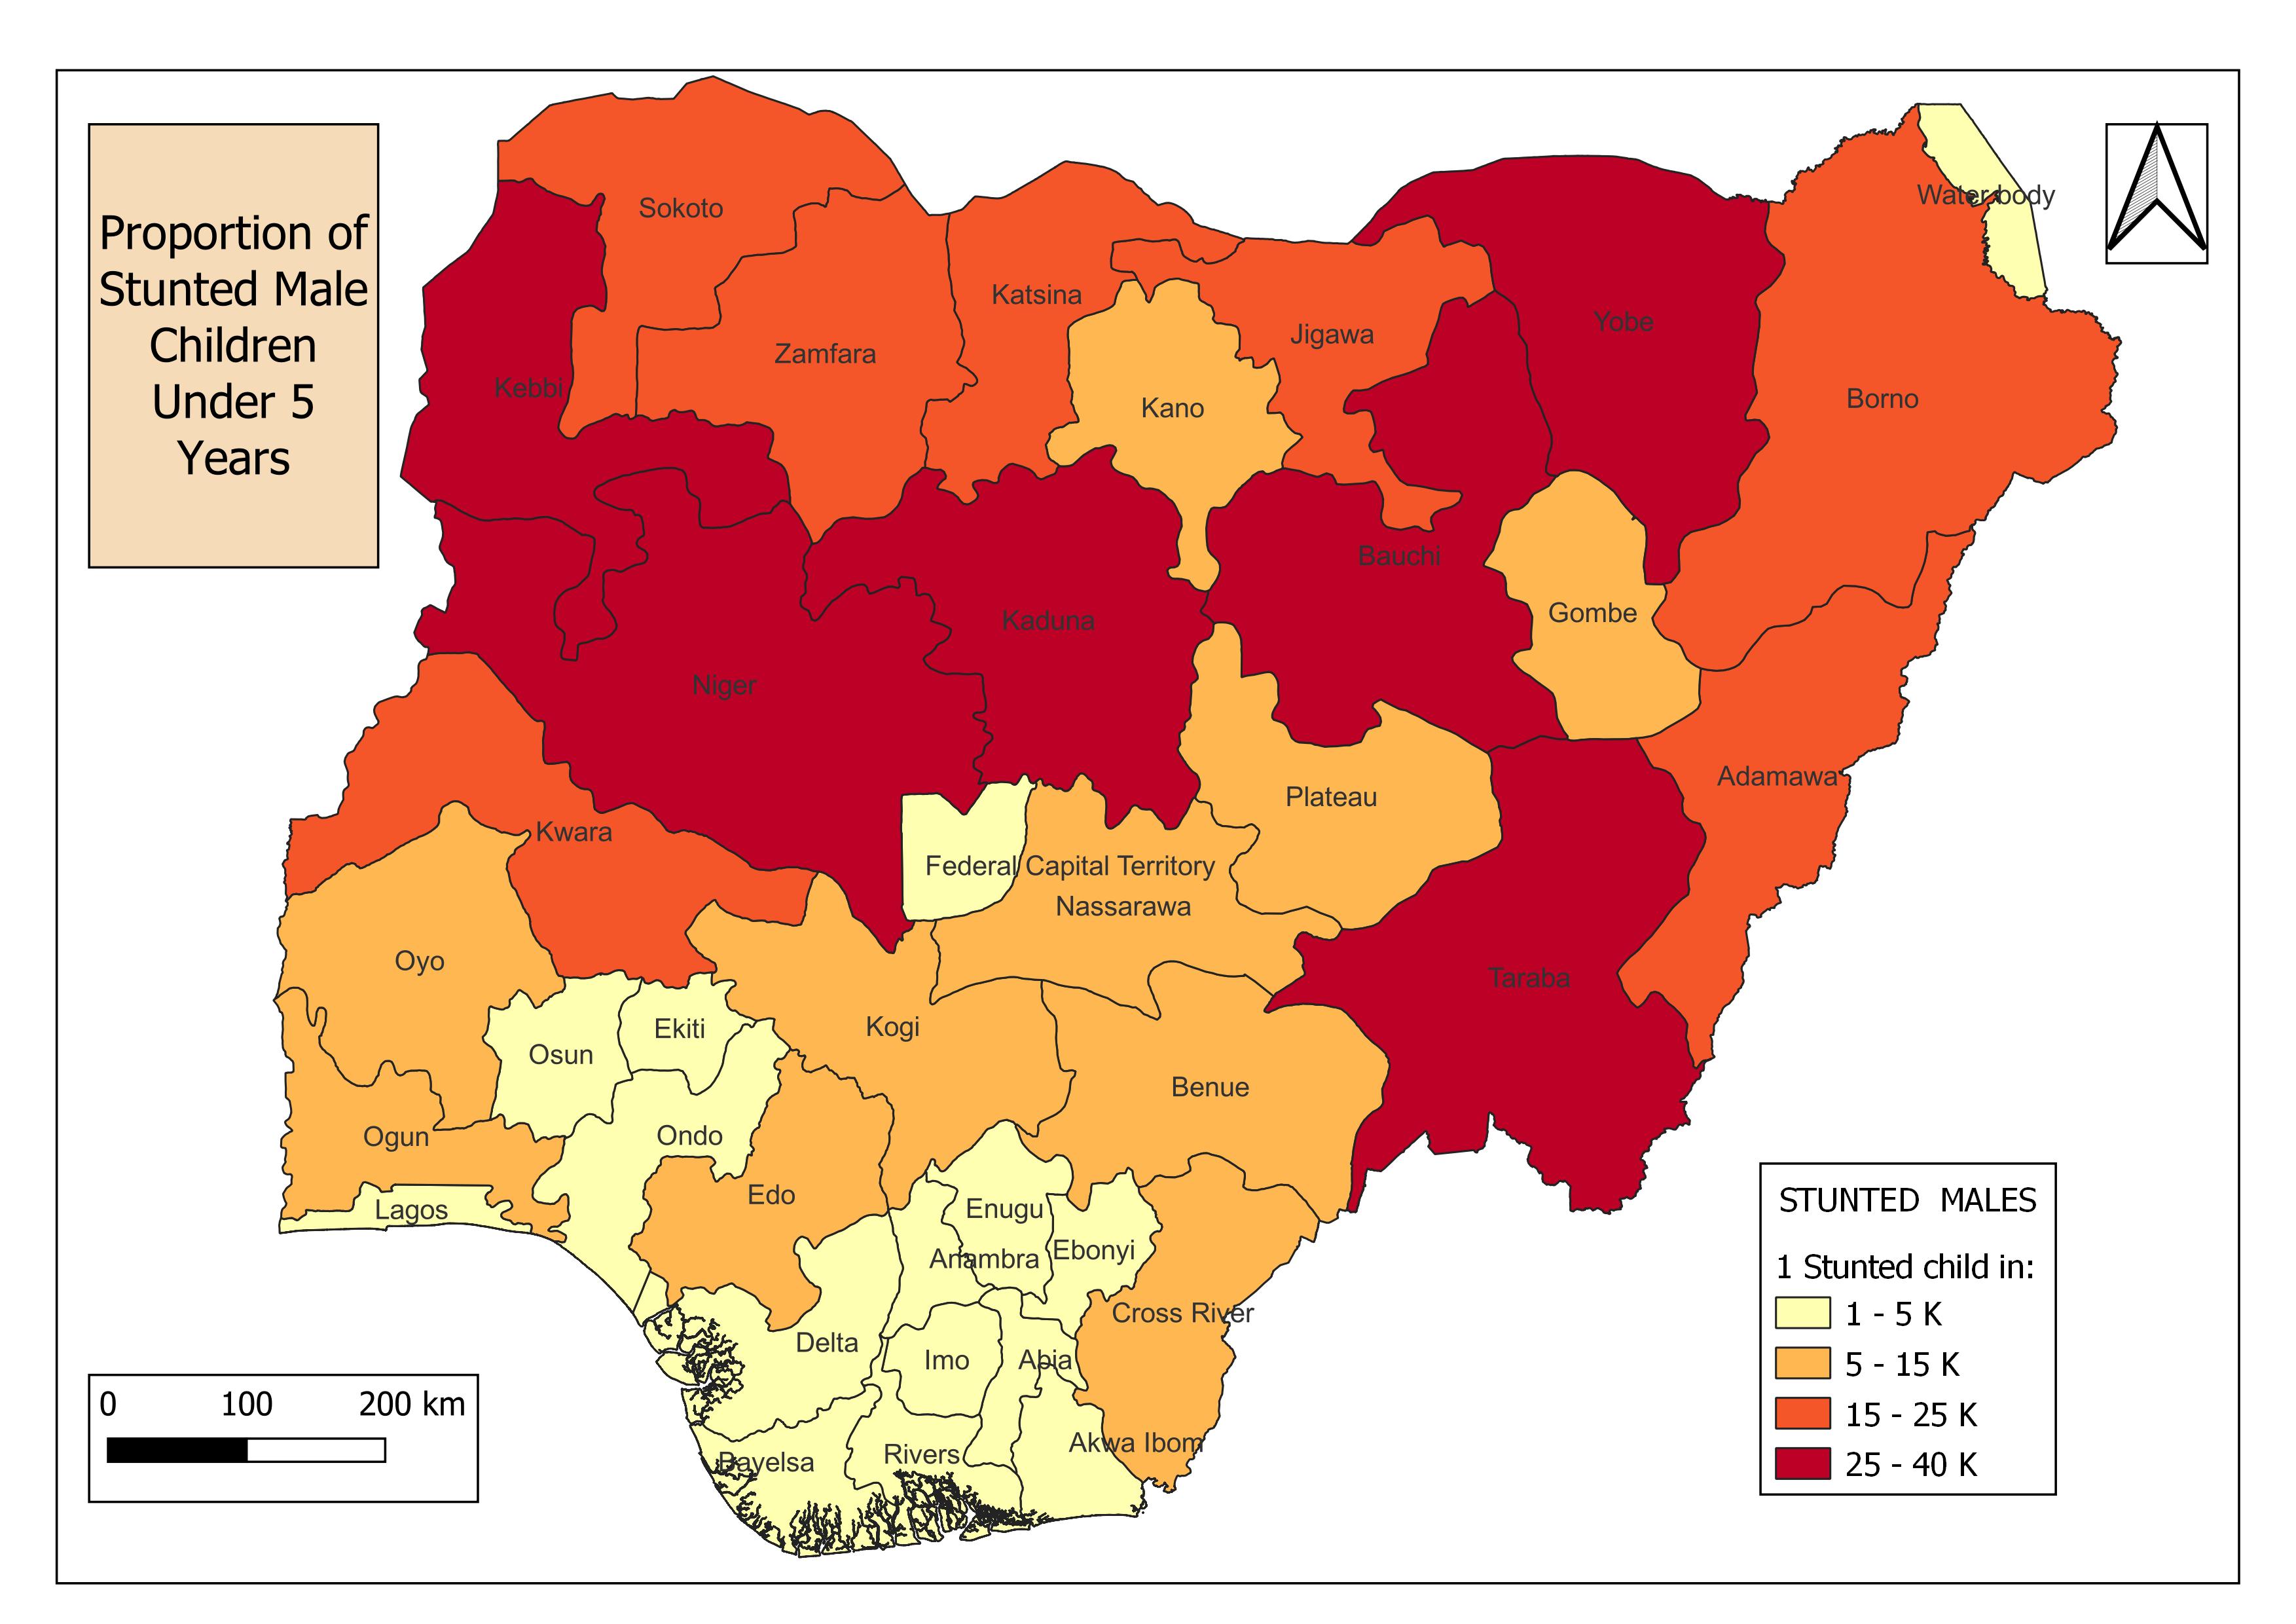
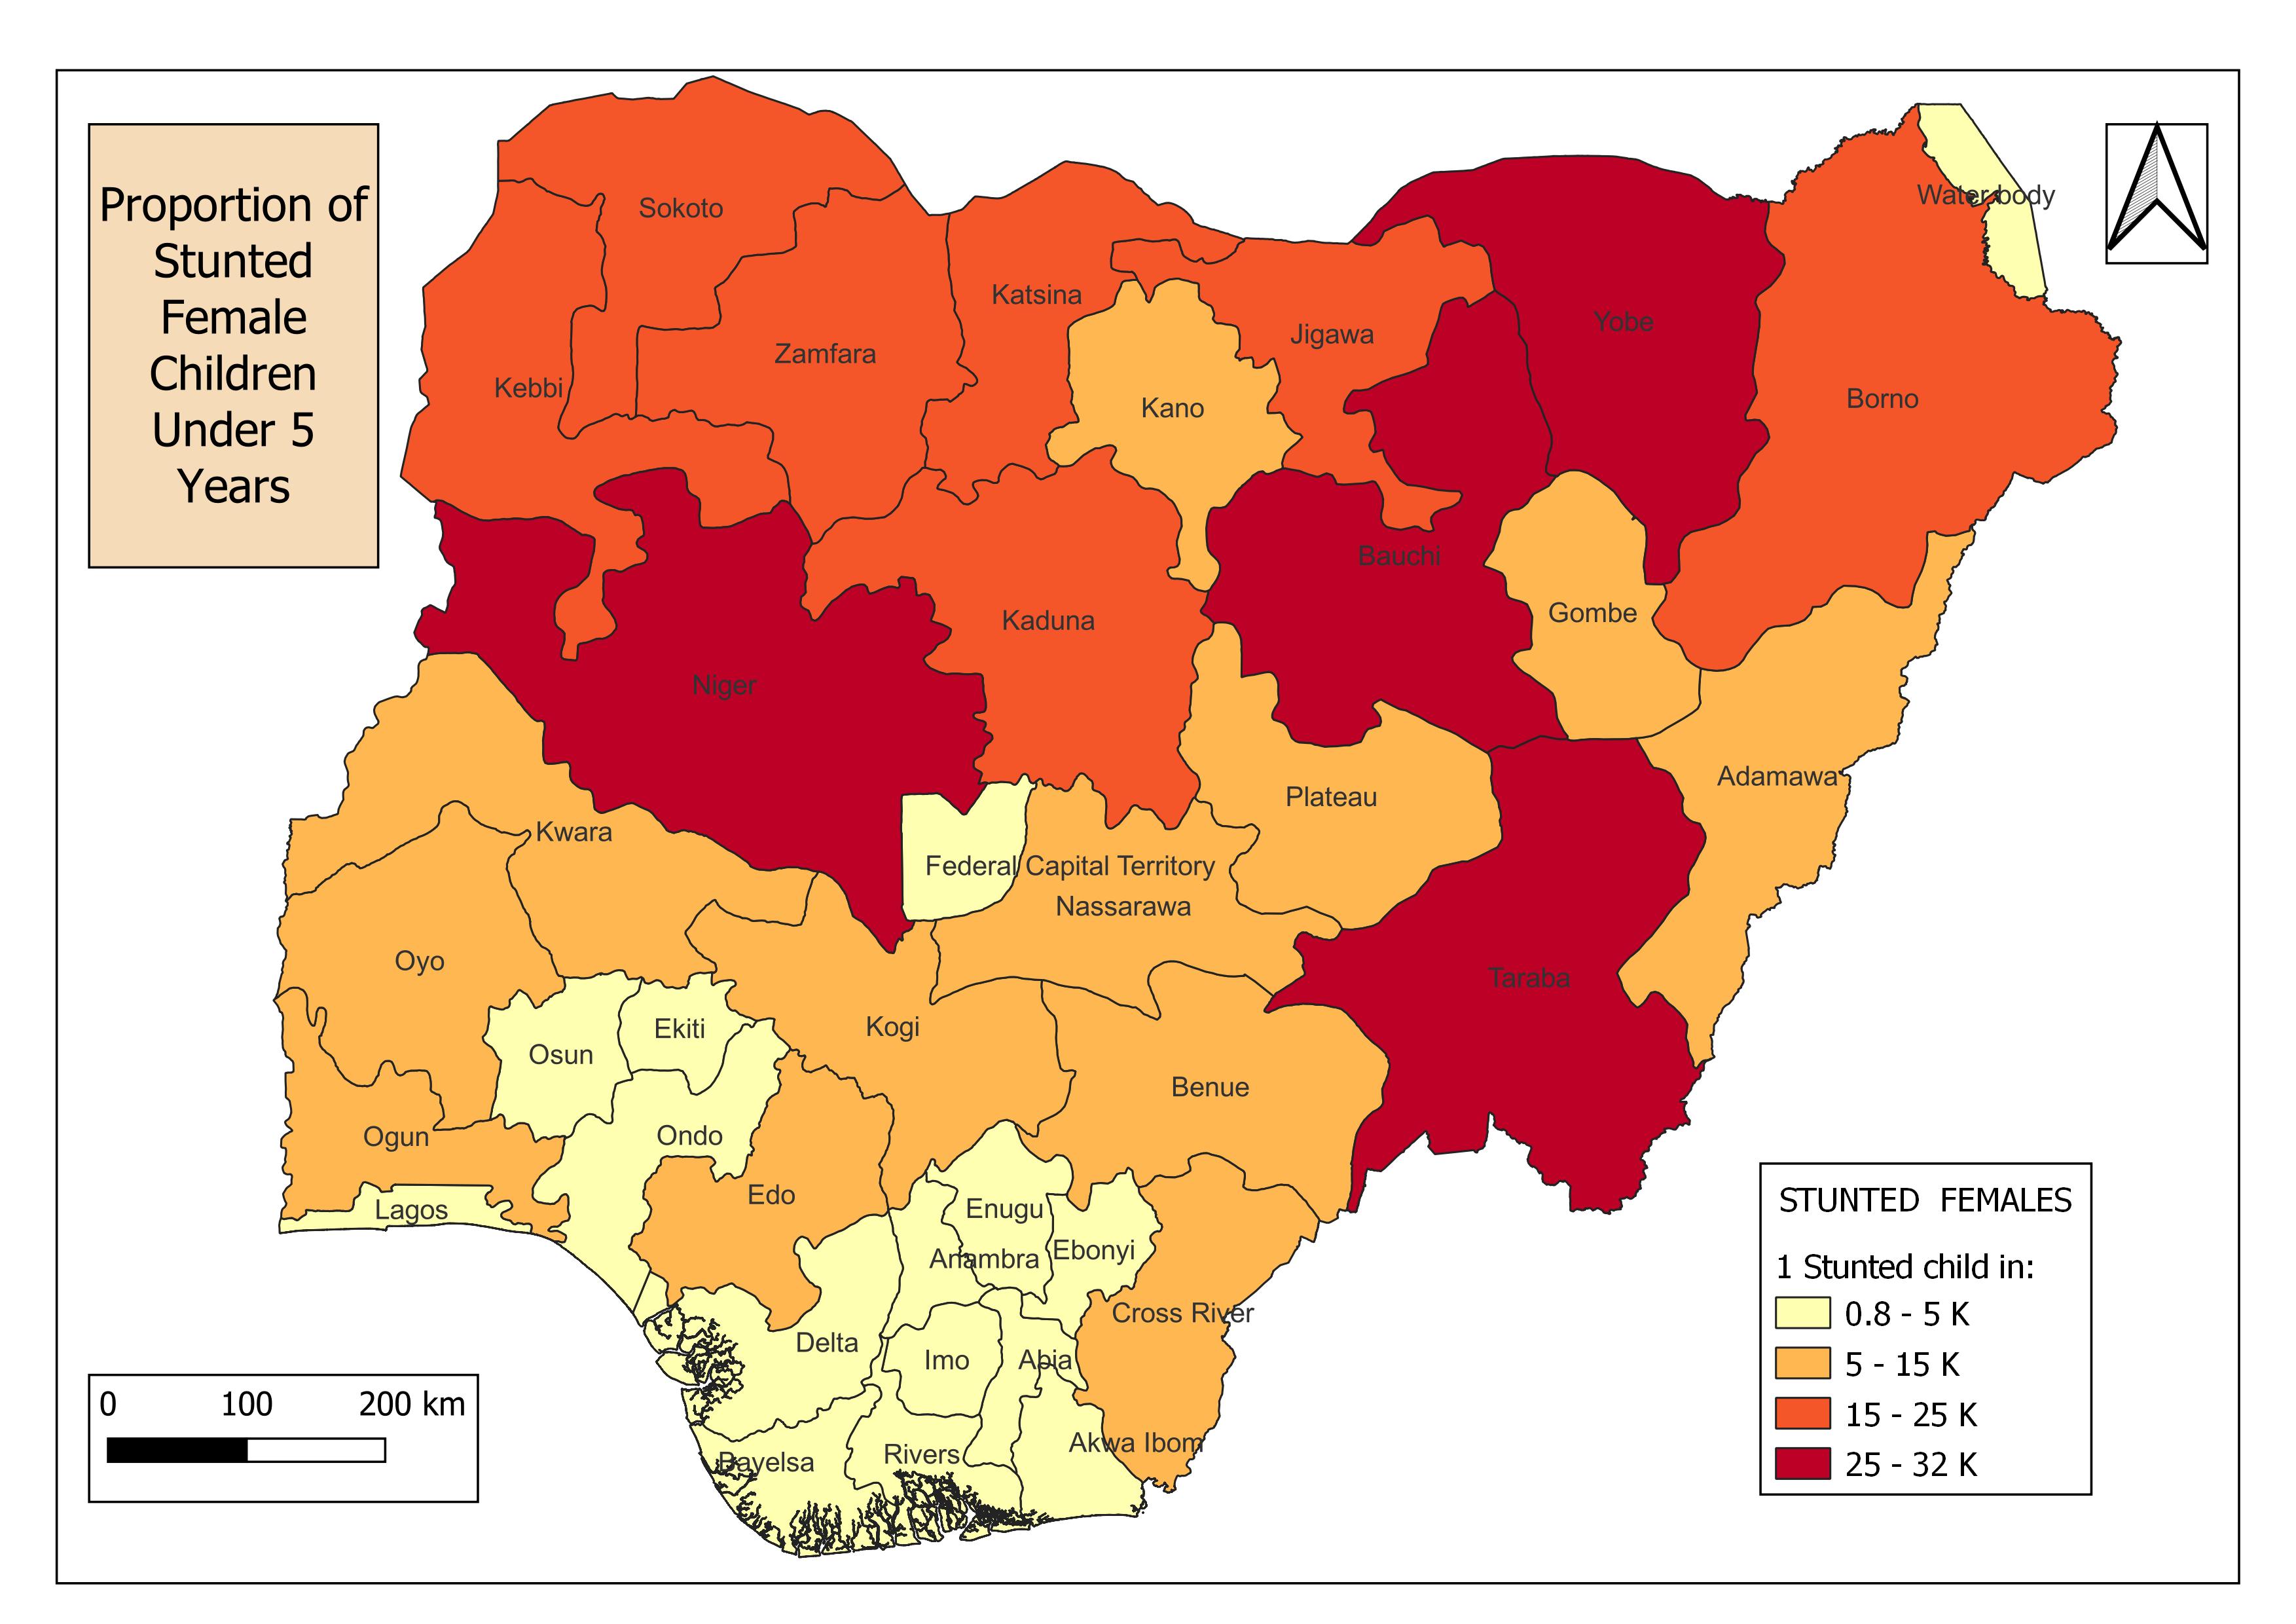
States in the highest of the four classes in the maps above, record ratios as high as 1:37,000+ for males and 1:31,000+ for females.
Finally, we consider a dataset that estimates vaccination coverage, i.e. proportions of children vaccinated, from 0 – 59 months in Nigeria. Grouping by states and classifying into four different classes produces the following map.
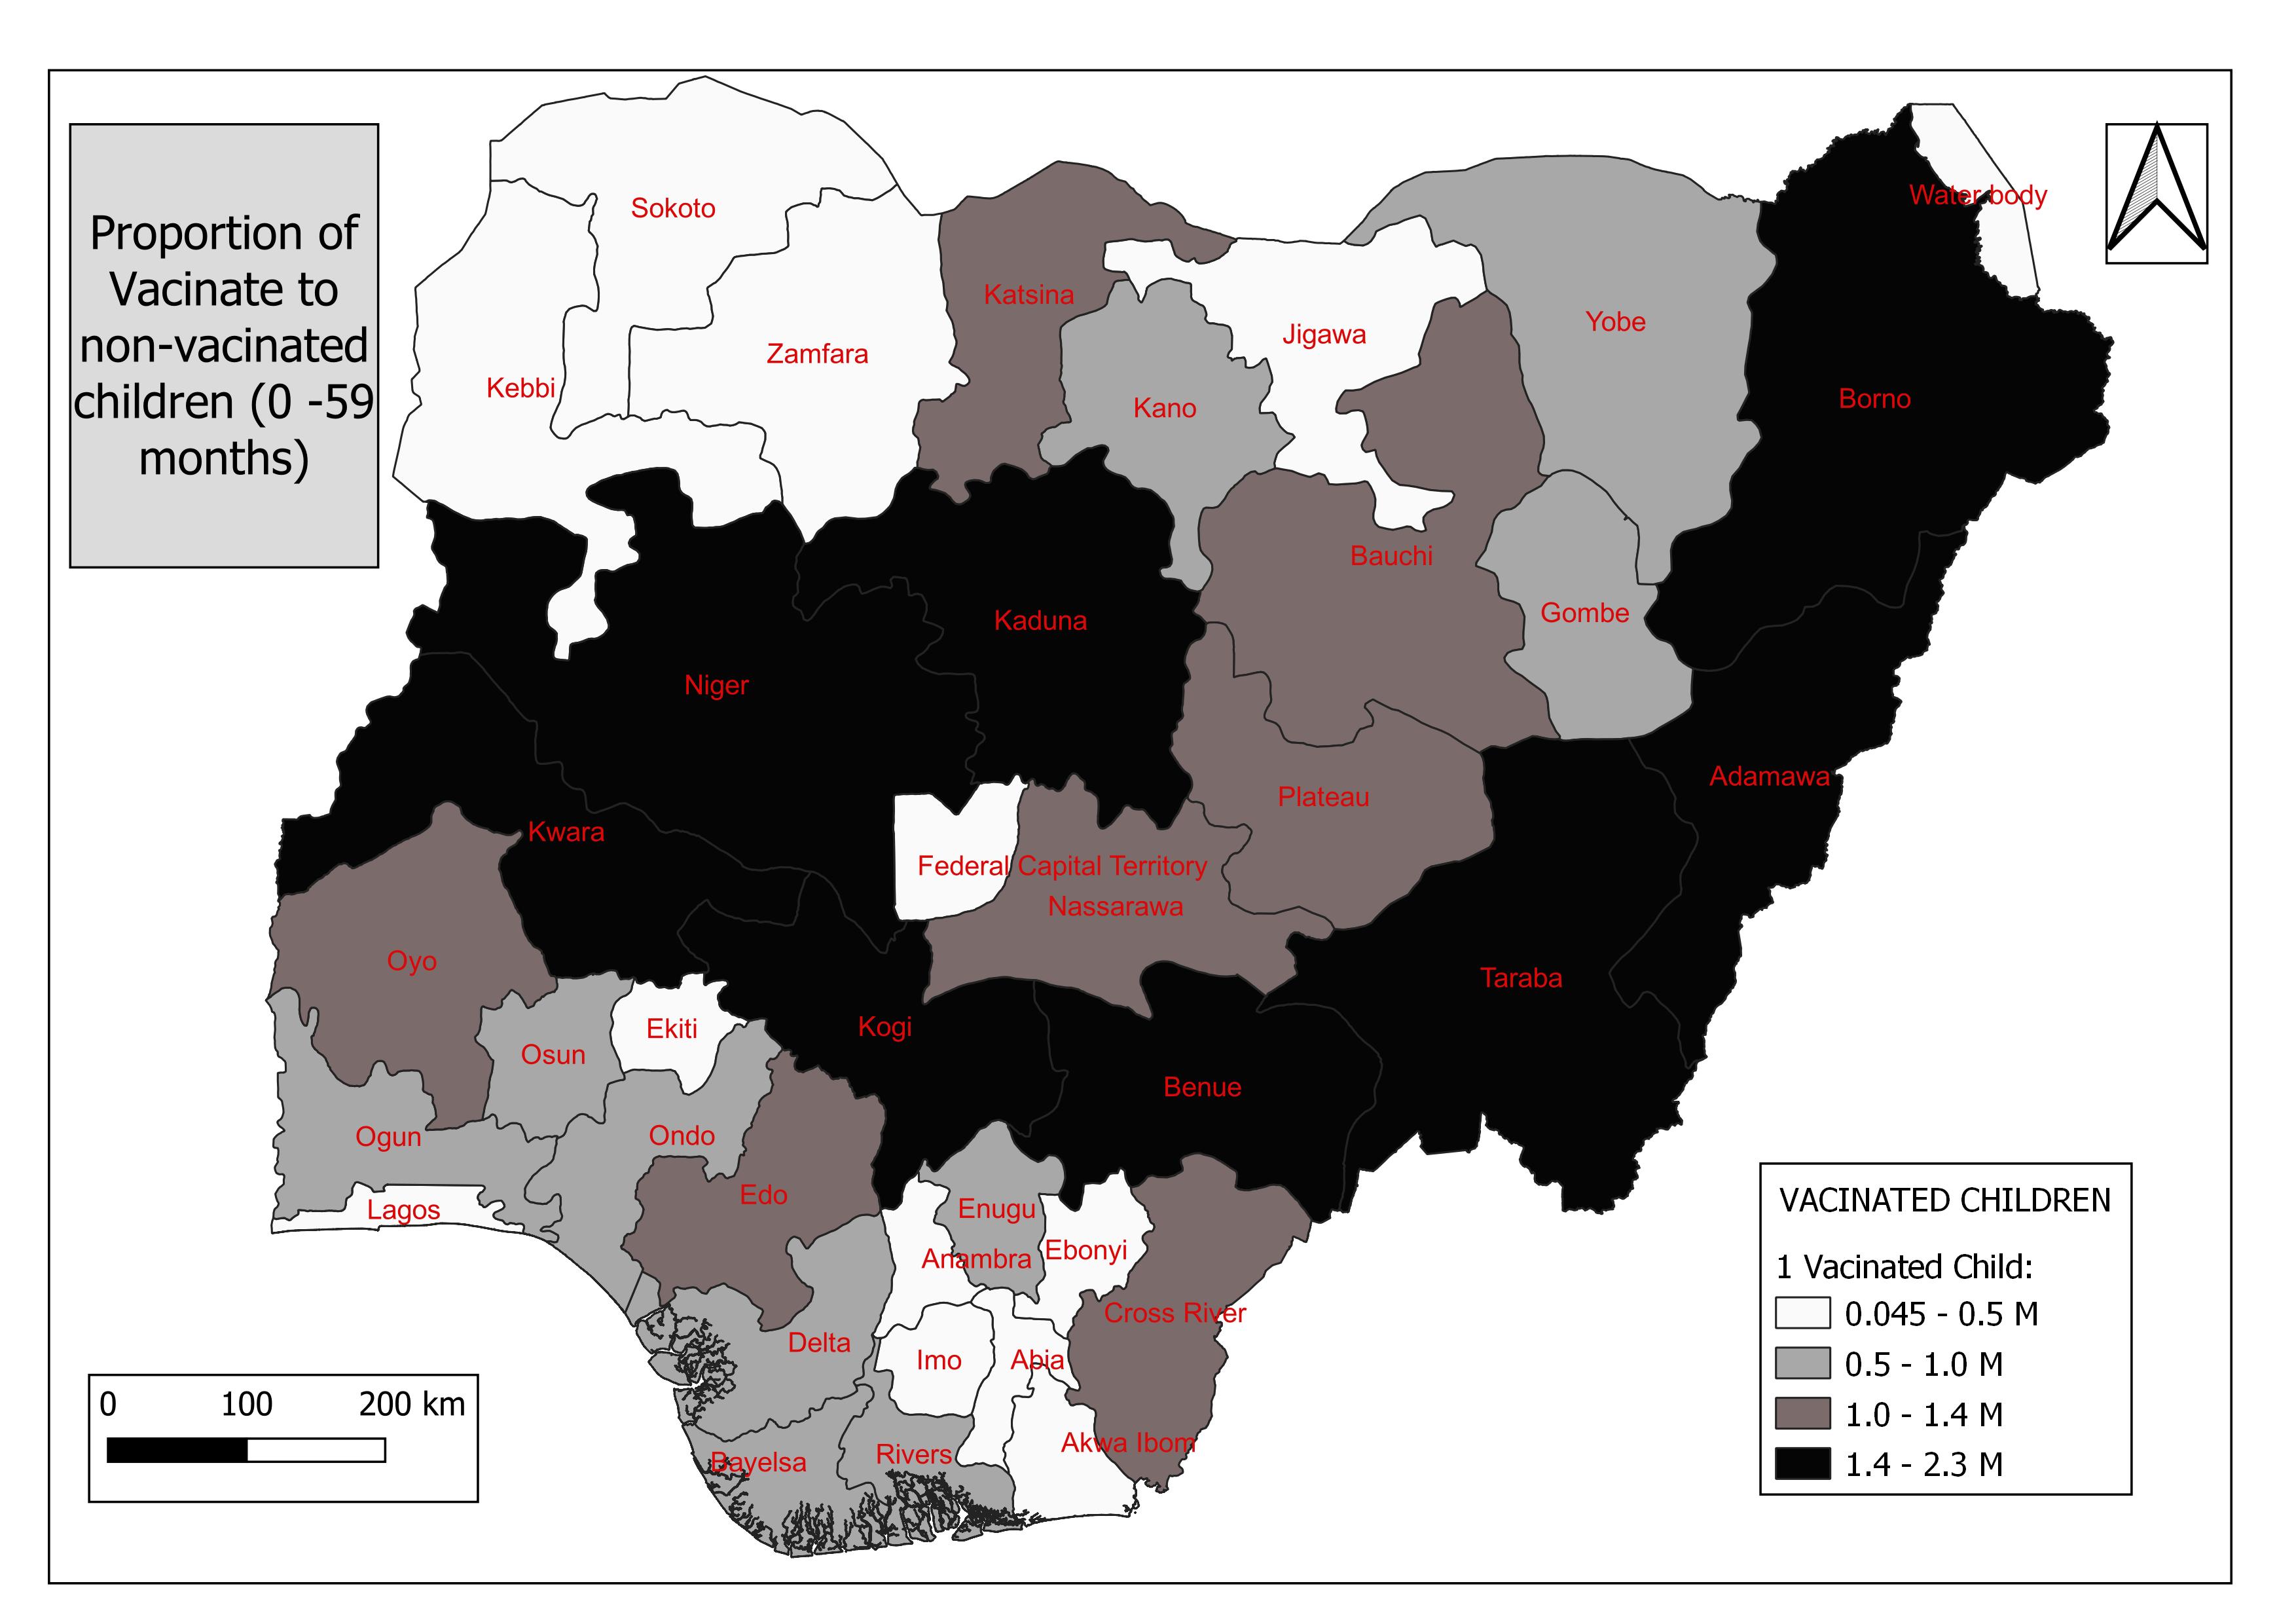
To put into perspective, for every 2.2 million children aged 0 to 59 months, only one is vaccinated in Taraba state. Seven other states keep them company in this category with ratios greater than 1:1.4 million vaccinated children.
So far in this analysis, we have created visualizations to answer the following questions:
Which states have the largest population head count?
Which states have the greatest number of births?
What percentage of pregnancies will likely lead to successful births?
Which states have the highest per cent of their population living with under $2.00 and $1.25 per day?
Which states have the largest proportion of literates to non-literates?
Which states have the highest proportion of stunted children under 5 years?
Which states have the highest proportion of vaccinated to non-vaccinated children from 0-59 months?
Now the big question is, does wealth and literacy level have an effect on the care provided to a child? To answer this, here’s a table showing the answers to questions 4 – 7 above.
SN | Under $2.00 | Under $1.25 | Male Proportion Literate | Female Proportion Literate |
| Male proportion Stunted | Female Proportion Stunted | Proportion Vaccinated |
1 | Taraba | Taraba | Niger | Taraba | Niger | Niger | Taraba | |
2 | Yobe | Yobe | Taraba | Kaduna | Bauchi | Bauchi | Kogi | |
3 | Niger | Niger | Borno | Niger | Taraba | Taraba | Niger | |
4 | Borno | Borno | Kaduna | Kogi | Yobe | Yobe | Kaduna | |
5 | Kwara | Nassarawa | Benue | Benue | Kaduna | Kaduna | Adamawa | |
6 | Nassarawa | Bauchi | Bauchi | Nassarawa | Kebbi | Borno | Kwara | |
7 | Kebbi | Kwara | Kogi | Plateau | Sokoto | Kebbi | Benue | |
8 | Adamawa | Adamawa | Adamawa | Cross River | Zamfara | Zamfara | Borno | |
9 | Zamfara | Zamfara | Nassarawa | Edo | Borno | Sokoto | Cross River | |
10 | Bauchi | Kebbi | Kwara | Adamawa | Katsina | Jigawa | Bauchi |
This can be easily achieved by sorting the attribute tables of each layer by the column of interest. Here, I chose a simple SQL code to rank each column.
SELECT   pregs_sum, RANK() over (ORDER BY pregs_sum DESC) as ranking, pregnancy.name_1,

FROM public.pregnancy

FETCH FIRST 10 ROWS ONLY;
The next table is a duplicate of the one above, excluding the state names that do not appear on both sides of the red-blue divide. That is, of the 15 states having the most percentage of its population living under $2.00 per day and the highest proportion of literate to non-literate population, for the highest proportion of stunted and vaccinated children.
SN | Under $2.00 | Under $1.25 | Male Proportion Literate | Female Proportion Literate |
| Male proportion Stunted | Female Proportion Stunted | Proportion Vaccinated |
1 | Taraba | Taraba | Niger | Taraba | Niger | Niger | Taraba | |
2 | Yobe | Yobe | Taraba | Kaduna | Bauchi | Bauchi | Kogi | |
3 | Niger | Niger | Borno | Niger | Taraba | Taraba | Niger | |
4 | Borno | Borno | Kaduna | Kogi | Yobe | Yobe | Kaduna | |
5 | Kwara |
| Benue | Benue | Kaduna | Kaduna | Adamawa | |
6 |
| Bauchi | Bauchi | Nassarawa | Kebbi | Borno | Kwara | |
7 | Kebbi | Kwara | Kogi |
|
| Kebbi | Benue | |
8 | Adamawa | Adamawa | Adamawa | Cross River | Zamfara | Zamfara | Borno | |
9 | Zamfara | Zamfara |
|
| Borno |
| Cross River | |
10 | Bauchi | Kebbi | Kwara | Adamawa |
|
| Bauchi |
At this point, we can satisfyingly say that there is a direct relationship between the lack of wealth and the exposure of parents to the lack of care for their children. The solution of one will be a solution to the other. Until then, their inequality starts at their first breath and the effects may never get erased.
Stack: QGIS, PgAdmin, PostgreSQL (QGIS DB Manager)
About the author
Hi, I'm Leo. A Geomatician and Data Analyst who loves unfolding the metrics of daily human activities.
I recently started a YouTube channel where I share explainer videos on GIS analytical processes. And here I am, starting out a blog for the same purpose.
I'm currently working on adding a host of python libraries to my stack, and I'd be sure to update you as I do.
When I'm not writing codes or crunching numbers to inform Geospatial decisions, you'd find me writing texts on how exactly you can do that. Yes, a Technical Writer.
Here's my Stack: SQL {PostgreSQL, MySQL} Python {NumPy, Pandas, Matplotlib, Seaborn} GIS Applications [QGIS, ArcGIS, Google Earth Pro, AutoCAD]
Comments
Join the discussionNo comments yet. Be the first to comment.